
Manufacturing and Analytical Characterization - Biomolecular

Valentin Poirier, PhD
Solution Product Manager
Bruker BioSpin
Wissembourg Cedex, Alsace, France
Valentin Poirier, PhD
Solution Product Manager
Bruker BioSpin
Wissembourg Cedex, Alsace, France
This study successfully demonstrates the capabilities of benchtop NMR-based analytical procedures for automated, accurate, and precise multi-attribute testing of biological formulations. The method effectively quantifies the panel of organic excipients typically present in such formulations, including critical and challenging surfactants. It achieves performance in terms of accuracy and precision that compares favorably with conventional chromatographic methods, while replacing multiple independent assays with a single, automated procedure. Moreover, it eliminates the need for sample preparation. Overall, this approach provides a simpler and faster methodology, enabling development and quality control laboratories to reduce turnaround times and minimize the number of analytical procedures required for biologic formulation testing.
References: R.G. Strickley, W.J. Lambert, Journal of Pharmaceutical Sciences 110 (2021) 2590−2608
C.A. Paschen, D. Klemm, T. Graf et al., Journal of Pharmaceutical and Biomedical Analysis 192 (2021) 113640
A. Martos et al., Journal of Pharmaceutical Sciences 109 (2020) 646-655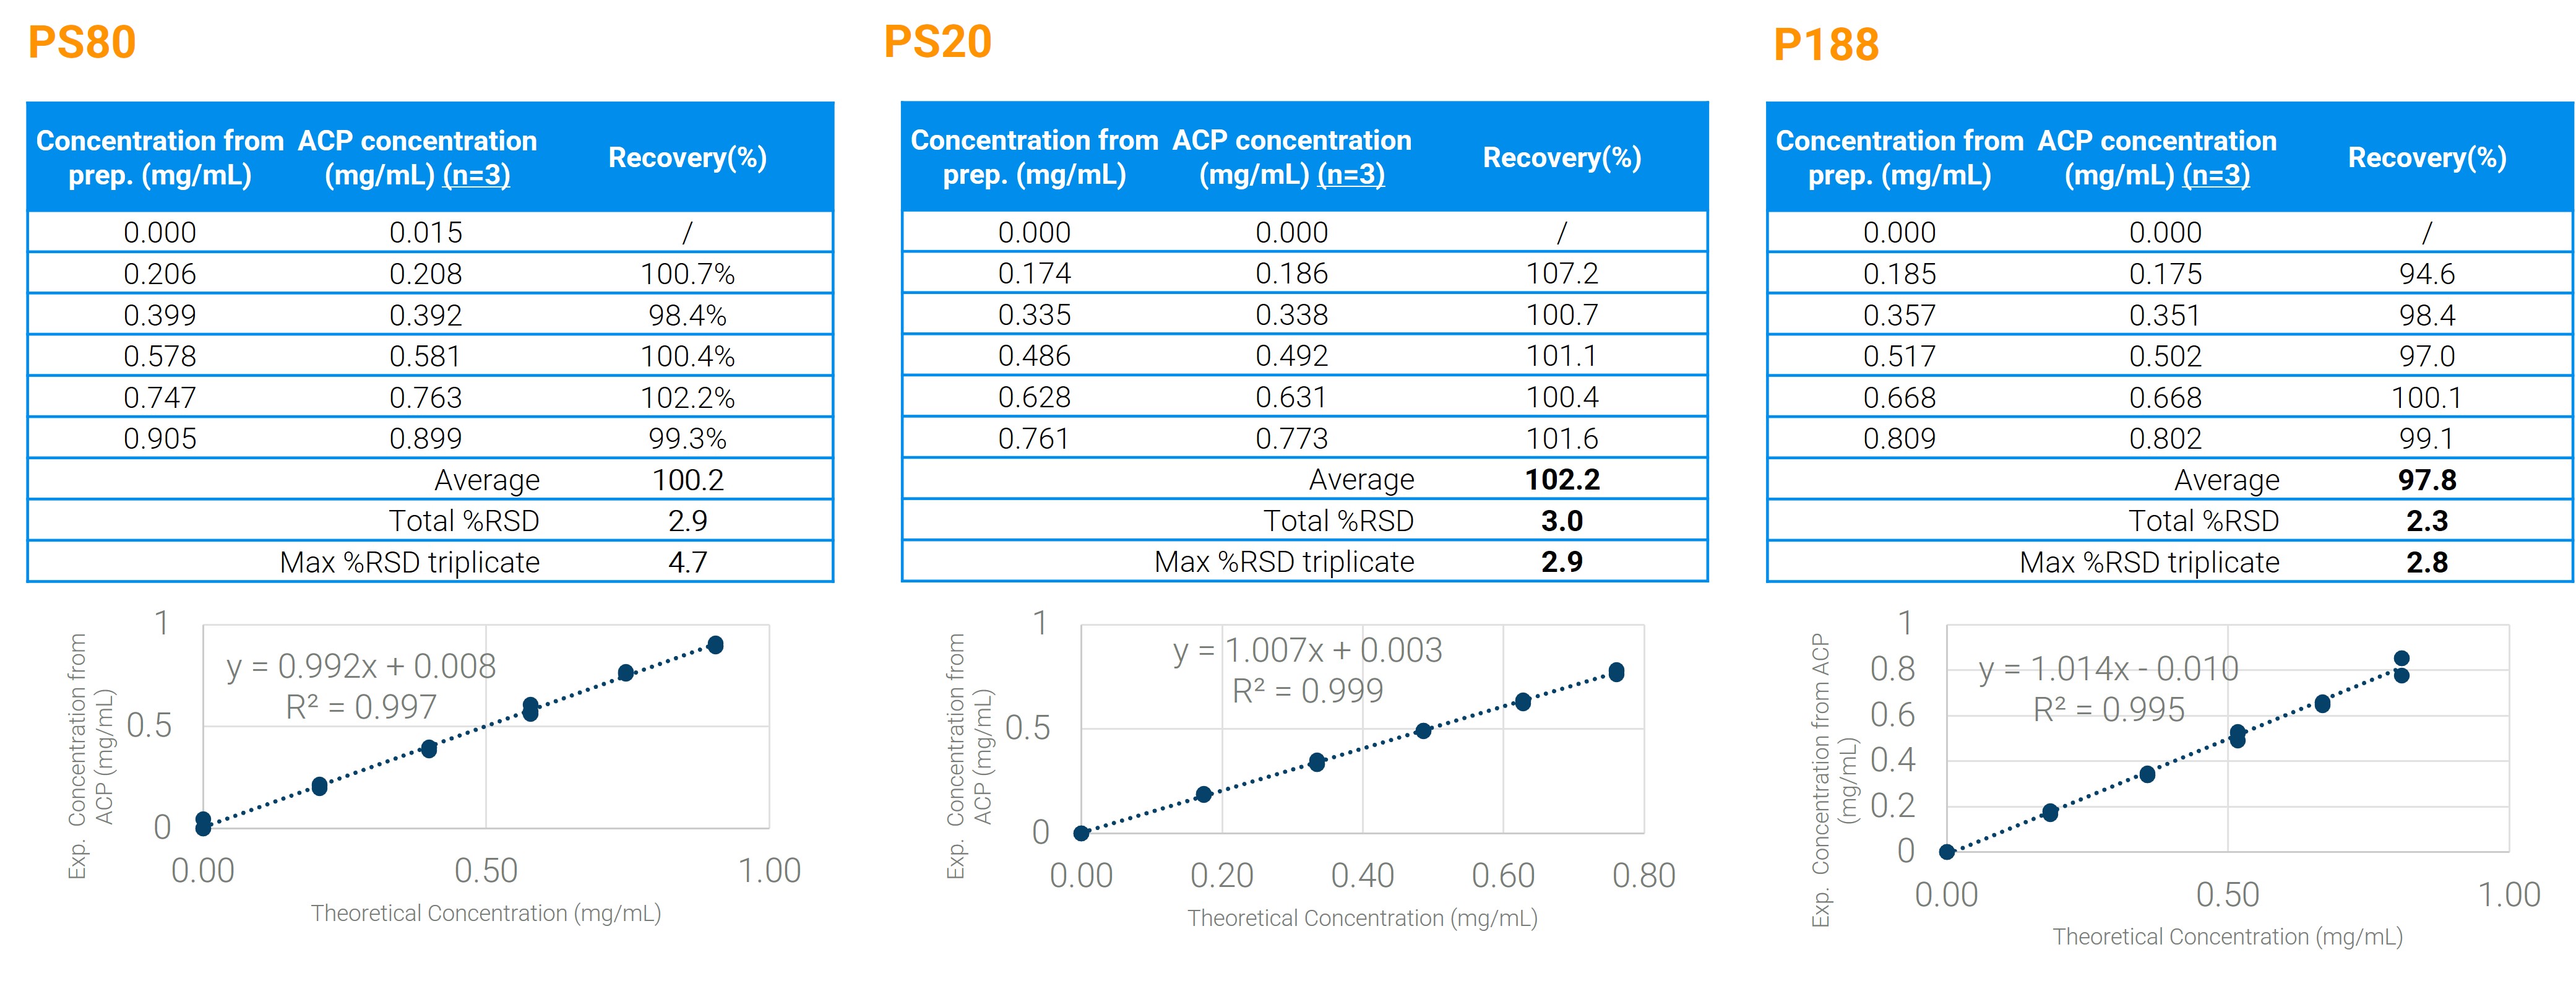
Figure 1: Example results obtained for the three main surfactants currently used in the market, using 6 levels of surfactant content in model formulations. Each formulation also contained sucrose, histidine, and methionine as additional excipients. For each concentration level, the average measured concentration and corresponding recovery from triplicate measurements are reported. Total %RSD represents the overall relative standard deviation across the entire dataset for the series. Max %RSD triplicate refers to the highest relative standard deviation observed among the individual triplicate measurements.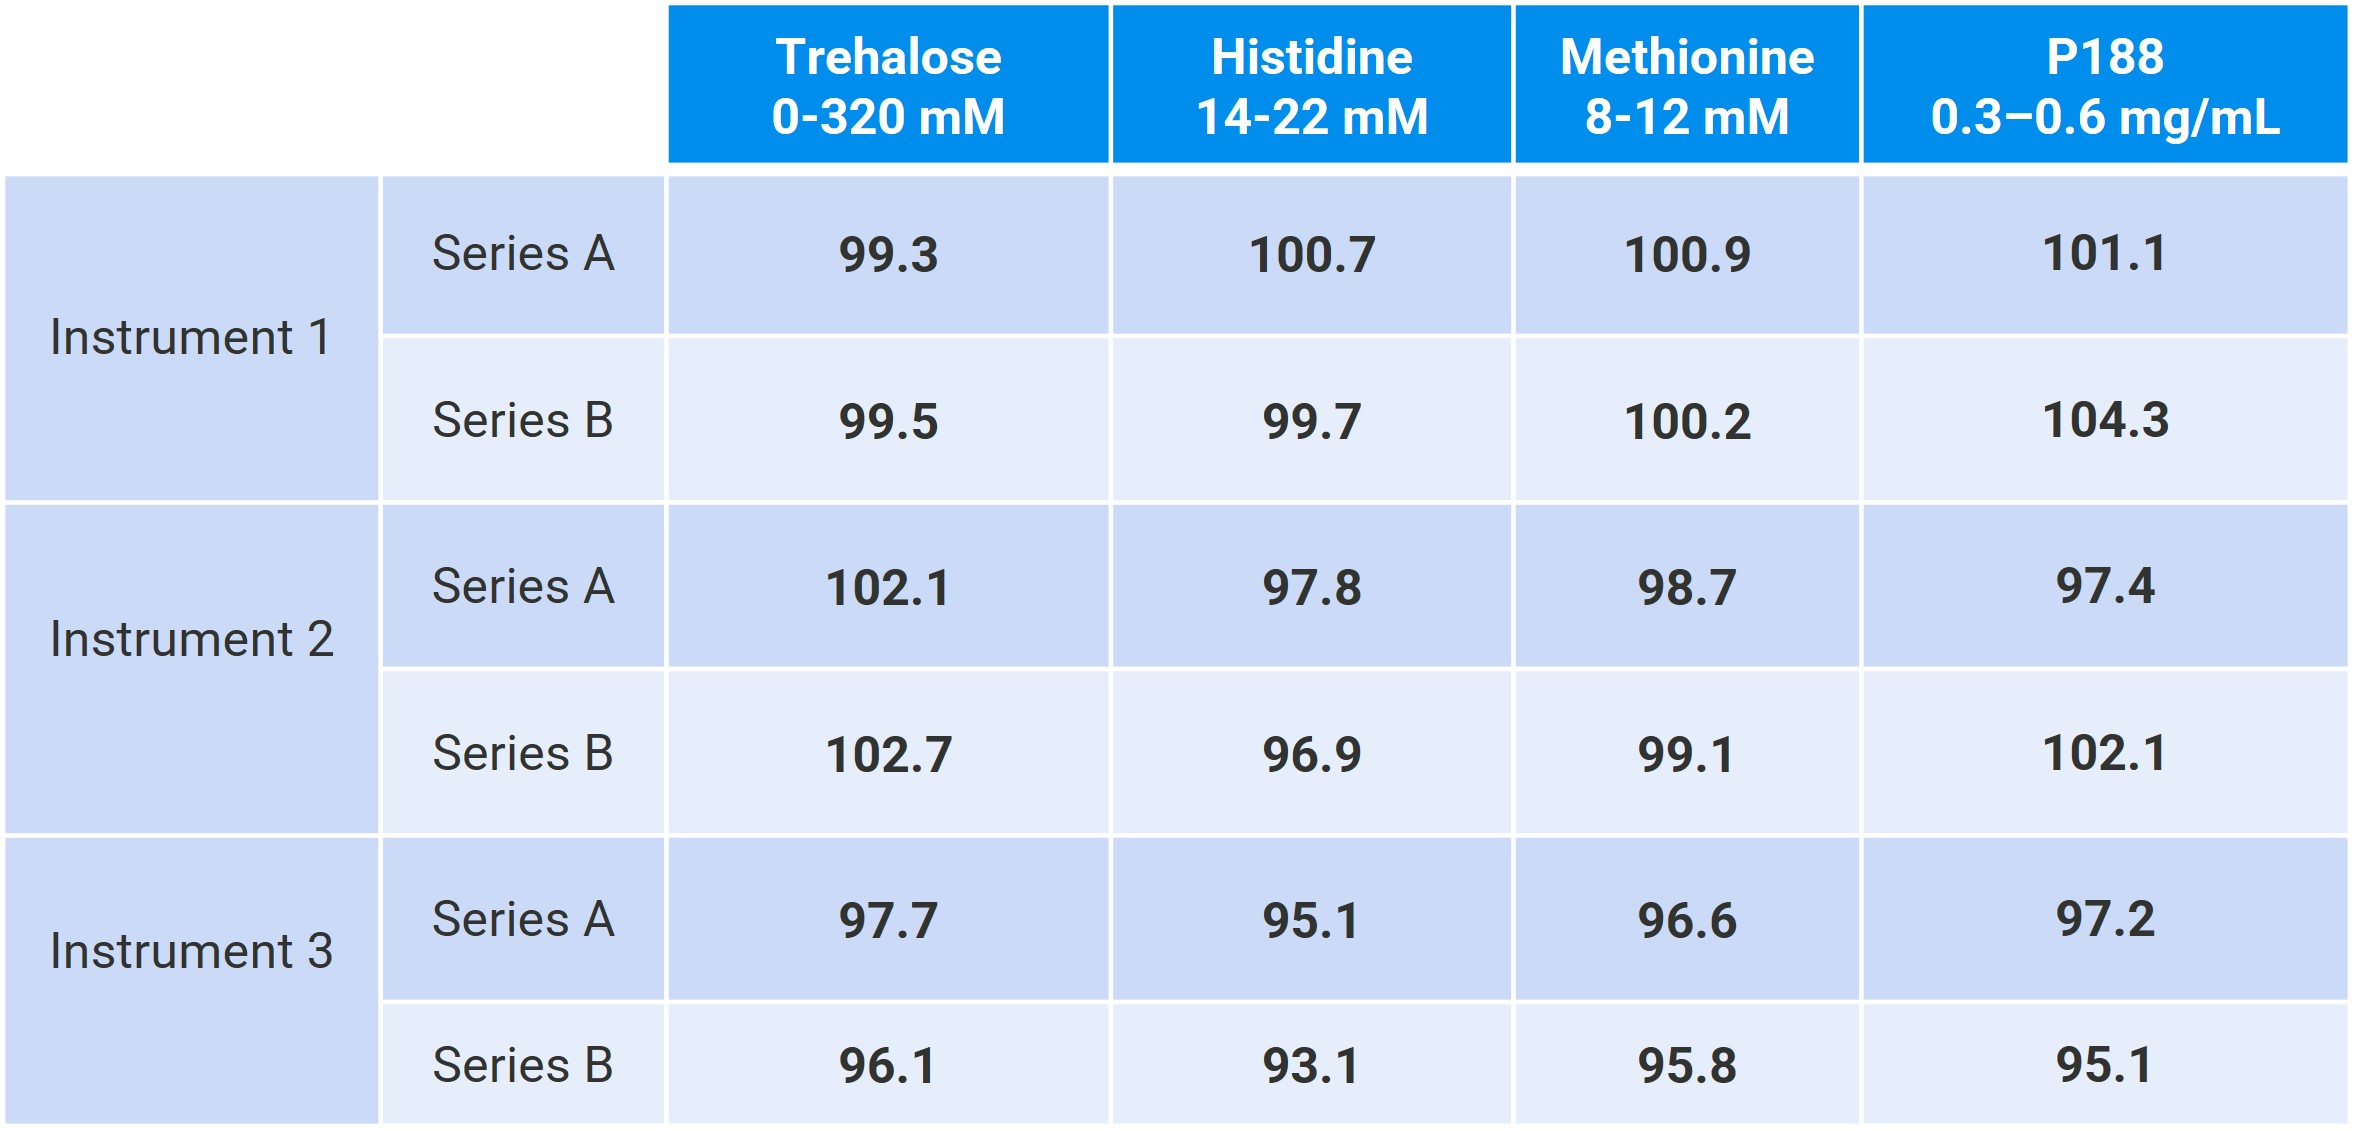
Table 1: Average recoveries obtained using two independent six-level series of model formulations analyzed across three instruments. Each preparation was measured four times, resulting in 24 data points per series and per instrument. All results were obtained under full automation using a single-point external calibration.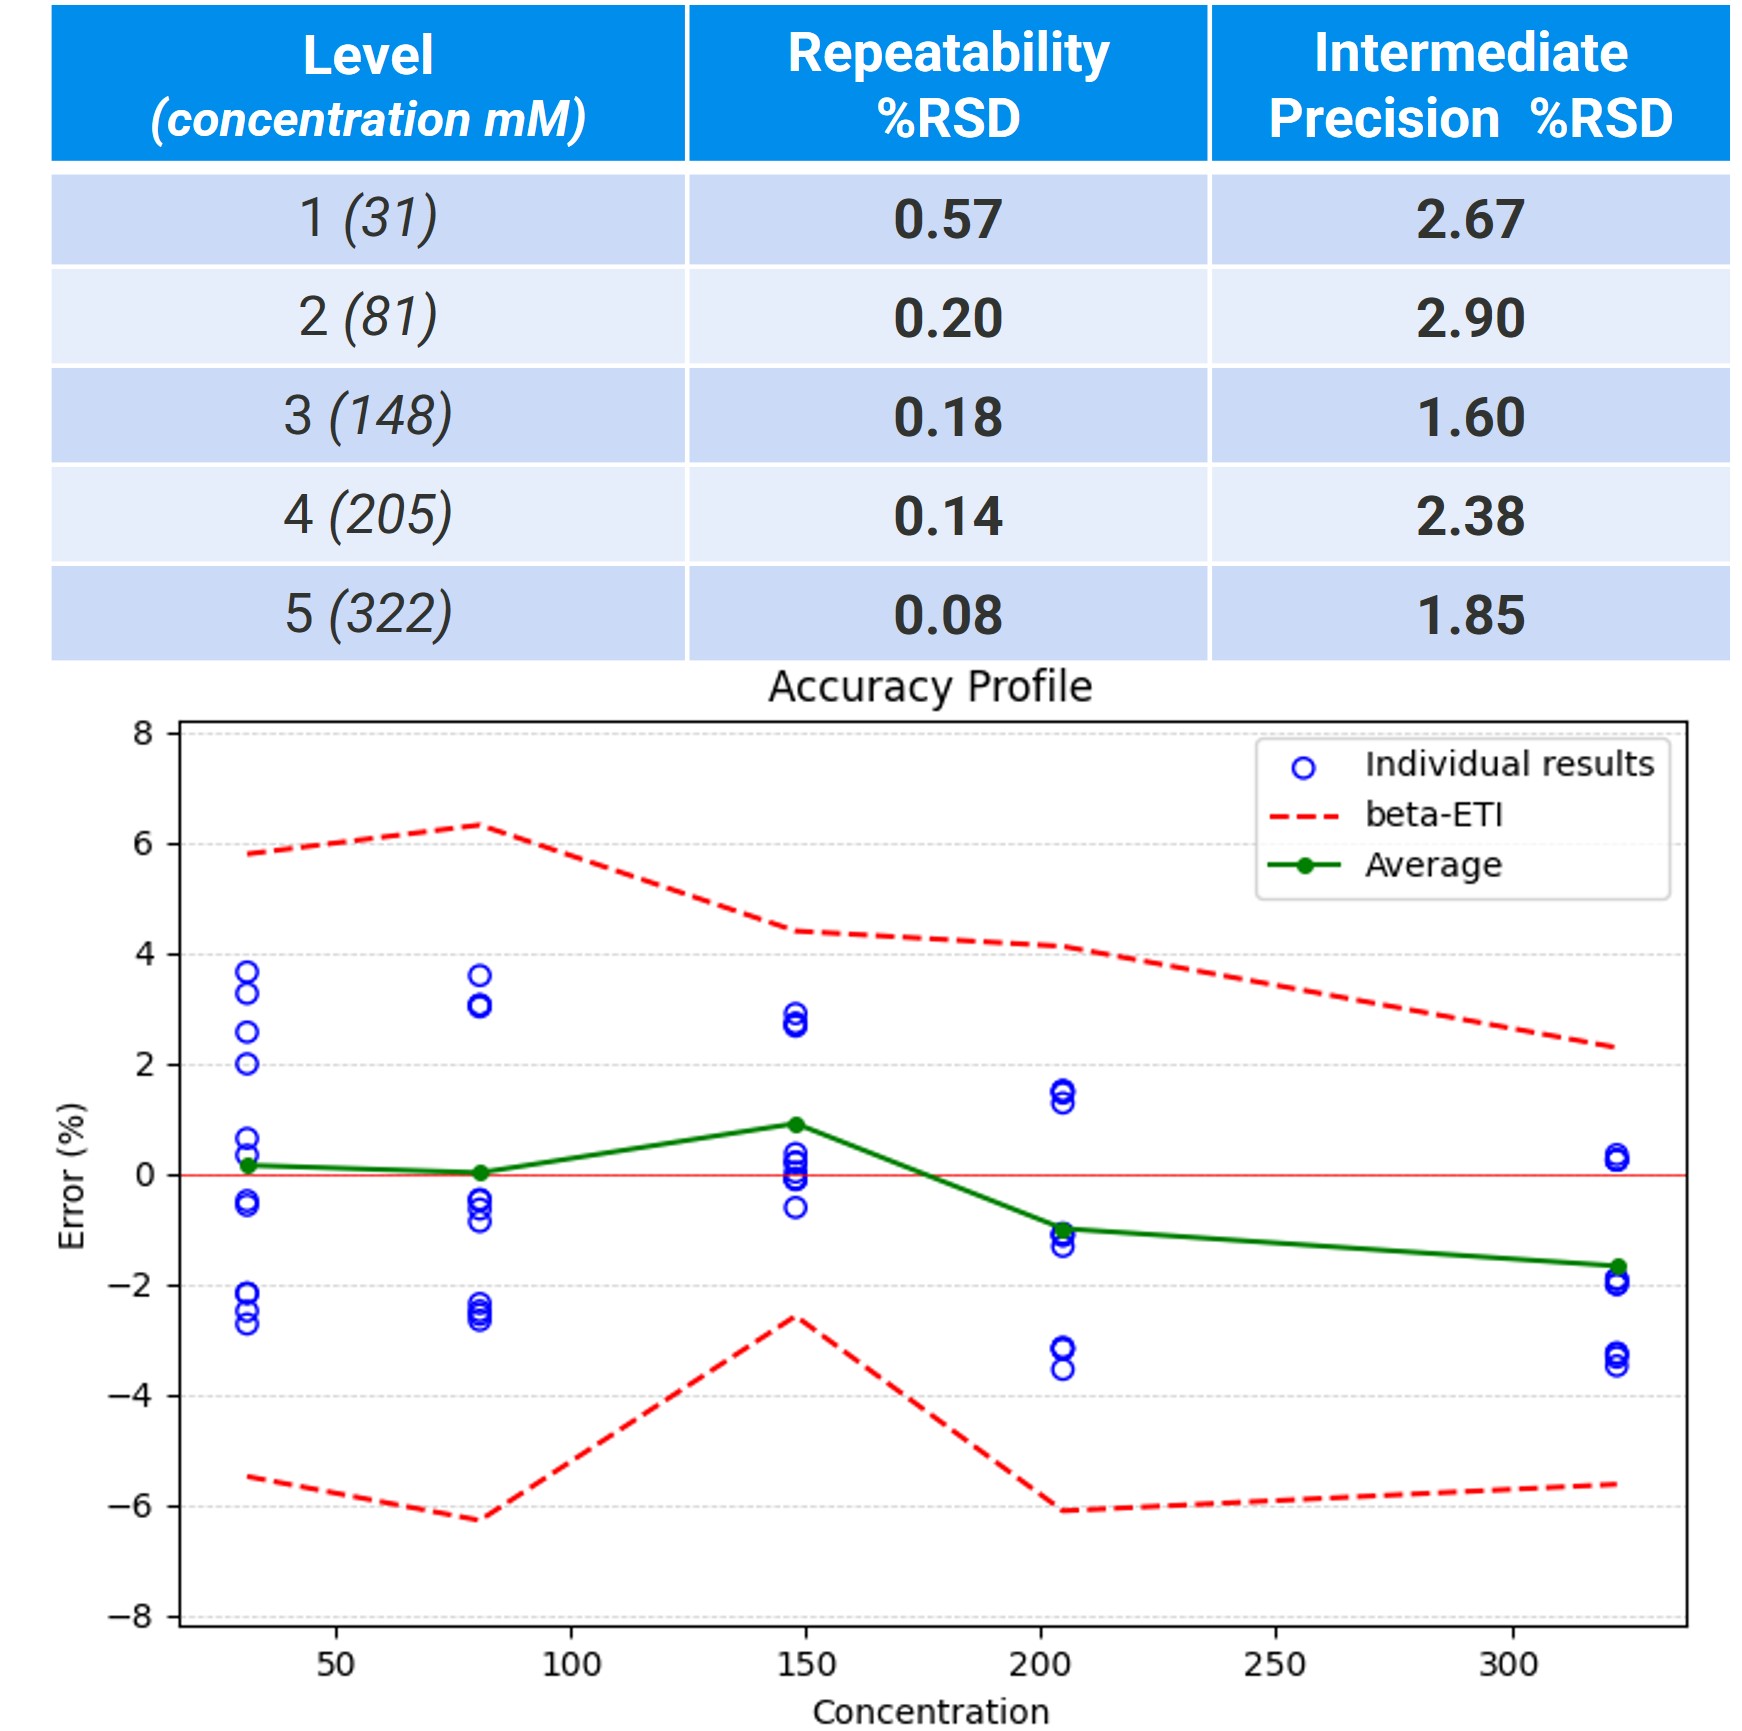
Figure 2: Detailed statistical analysis of trehalose in Series A (as presented in Table 1), showing for each concentration level the repeatability and intermediate precision expressed as relative standard deviations. The corresponding accuracy profile is reported as percentage error, using a β-expectation tolerance interval (beta-ETI) of 80%.