
Formulation and Delivery - Chemical

Niloufar Salehi, Ph.D.
Advisor
Eli Lilly and Company
Indianapolis, Indiana, United States
Mariana Romero-Gonzalez, MS
Graduate Student
University of Michigan
Indianapolis, IN 46202-4051, Indiana, United States
Mariana Romero-Gonzalez, MS
Graduate Student
University of Michigan
Indianapolis, IN 46202-4051, Indiana, United States
Robert D Van Horn, BS
Senior Advisor
Eli Lilly and Company
Indianapolis, IN 46202-4051, Indiana, United States
Youlin Liu, Ph.D.
Asvisor
Eli Lilly and Company
Indianapolis, IN 46202-4051, Indiana, United States
Suela Jonuzaj, Ph.D.
Asvisor
Eli Lilly and Company
Indianapolis, IN 46202-4051, Indiana, United States
Jeff Hanson, Ph.D.
Asvisor
Eli Lilly and Company
Indianapolis, IN 46202-4051, Indiana, United States

David C. Sperry, Ph.D.
Executive Director
Eli Lilly and Company
Indianapolis, IN, Indiana, United States
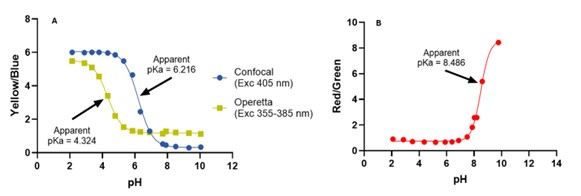 Figure 1. Calibration curves for: A) LysoSensor Yellow/Blue DND-160 showing the relationship between pH and blue-to-yellow fluorescence intensity ratio, Zeiss confocal microscope (Yellow Emission: 499-517 nm; Blue Emission: 418-491 nm) and the Operetta (Yellow Emission: 500-550 nm; Blue Emission: 430-500 nm) , B) SNARF-5F dye showing the relationship between pH and the red-to-green fluorescence intensity ratio (Red Emission: 629-670 nm; Green Emission: 561-597 nm.
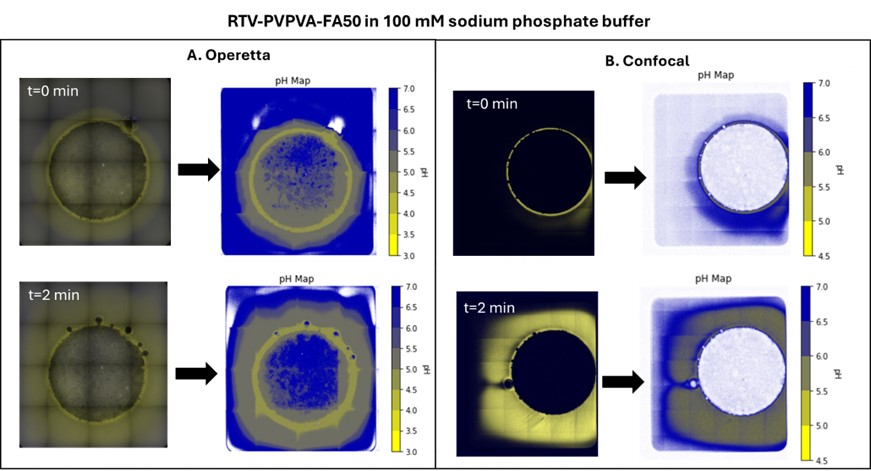 Figure 2. Interfacial and boundary layer pH mapping at initial compact submerging (t = 0 min) and two minutes after submerging (t = 2 min) using LysoSensor Yellow-Blue DND-160, comparison between A) Operetta imaging system and B) Zeiss microscope. A) At both time points, pH maps generated using the Operetta files and calibration revealed an interfacial pH of 4.5-5.0 and a boundary layer pH of 5.0-5.5 in the area closer to the solid compact, and the pH increased to 5.5-6.0 and then to 6.5-7.0 as the radius from the center of the compact increased. This decreased pH radius increased from 0 to 2 minutes. B) In the case of the maps from the Zeiss images, the pH at the interface at time = 0 minutes, was estimated to be 5.5-6.0, with no change of pH observed on the boundary layer. After 2 minutes, the boundary layer radius had increased considerably, and both the interface and the boundary layer were mapped as a pH of 5.5-6.0.