
Manufacturing and Analytical Characterization - Biomolecular
Mohamed I. I. Gadallah, MS (he/him/his)
PhD Graduate Student
University of Texas at Austin
Austin, Texas, United States
Mohamed I. I. Gadallah, MS (he/him/his)
PhD Graduate Student
University of Texas at Austin
Austin, Texas, United States
Noha M. El Zahar, PhD
Associate porfessor
Ain Shams University
Cairo, Al Qahirah, Egypt
Thanh Nguyen, BS
PhD Graduate Student
University of Texas at Austin
Austin, Texas, United States
Hanlin Ren, BS
PhD Graduate Student
University of Texas at Austin
Austin, Texas, United States
Jennifer S. Brodbelt, Ph.D.
Department Chair
University of Texas at Austin
Austin, Texas, United States
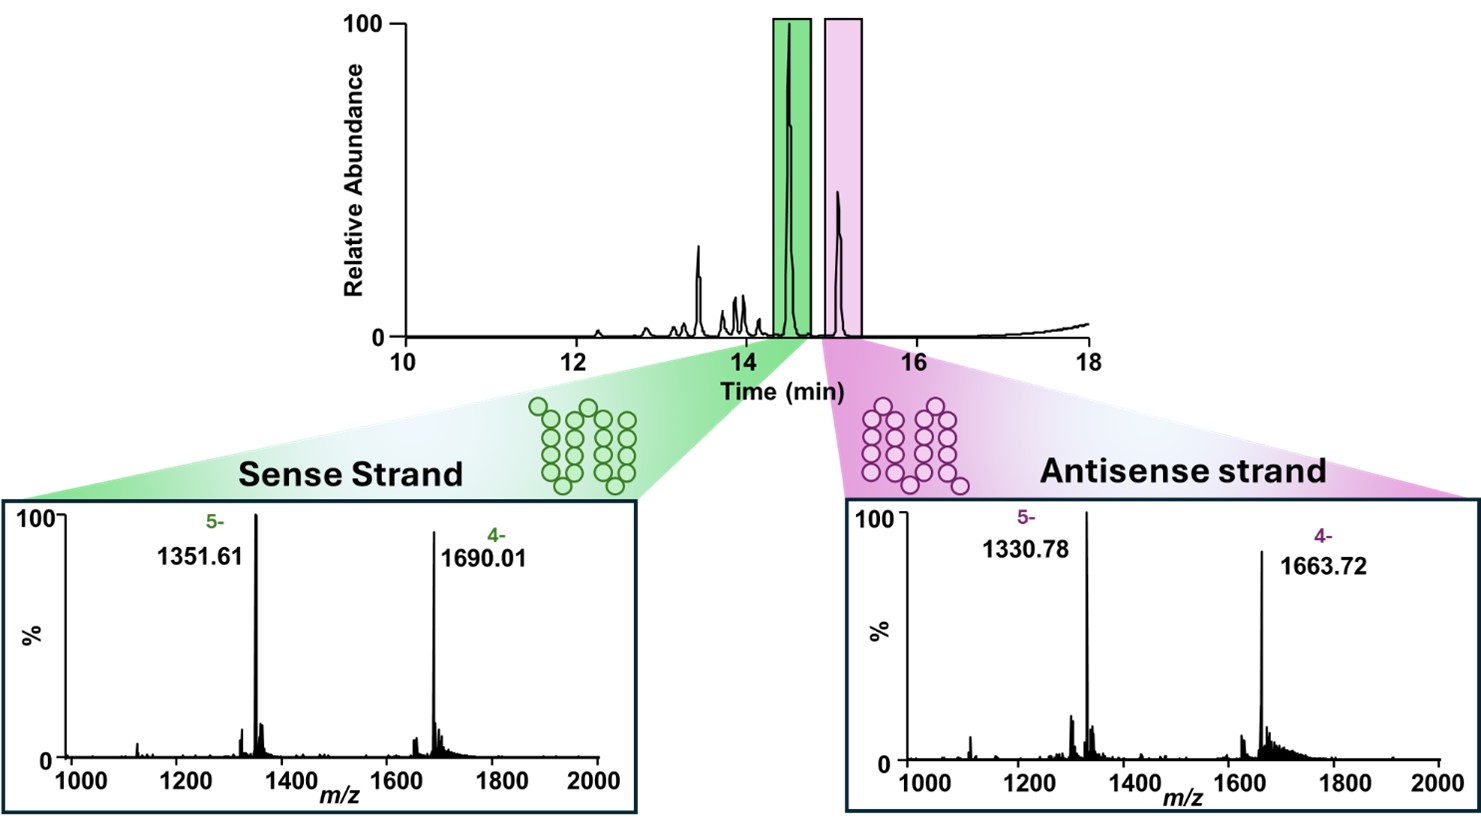 Figure 1. Separation and detection of sense and antisense strands of Patisiran siRNA using HILIC-MS. The GTx Resolve BEH Amide column enables baseline resolution of the sense (green) and antisense (purple) strands under MS-compatible conditions using 10 mM ammonium acetate. Inset graphs represent MS1 spectra acquired for each peak and confirm the identity of the individual strands based on their intact molecular mass.
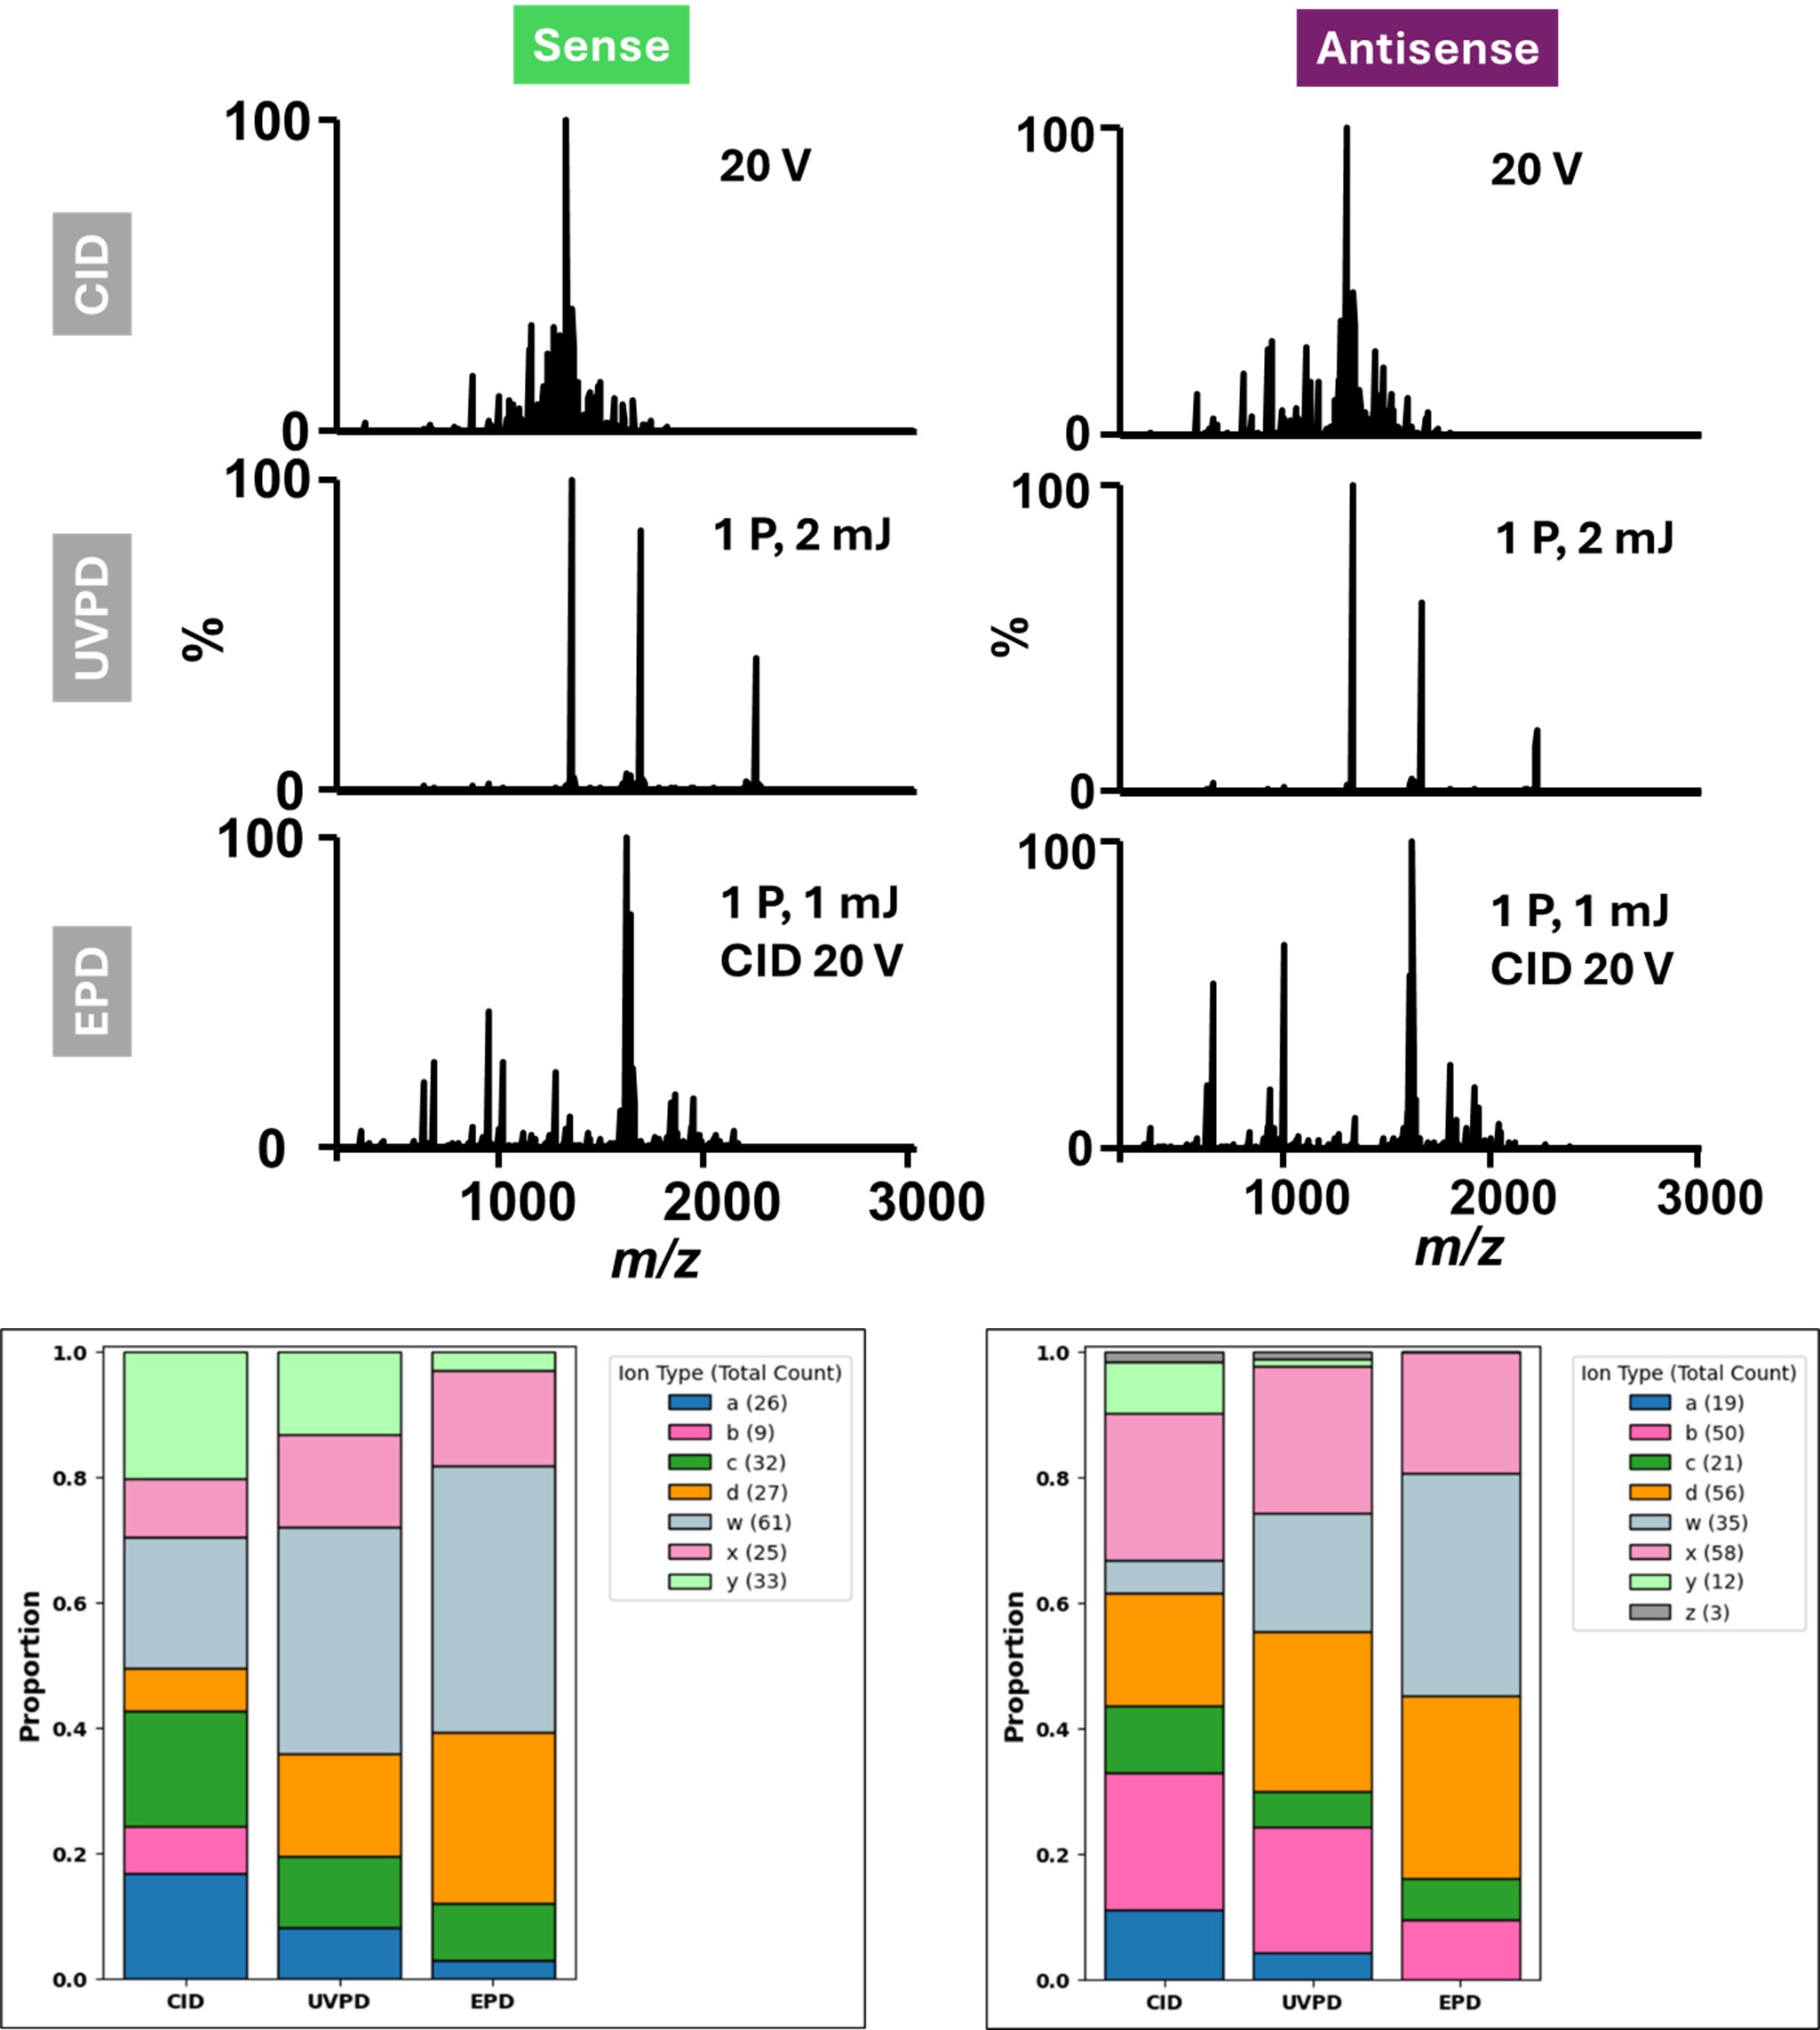 Figure 2. Comparison of gas-phase activation methods for structural characterization of sense and antisense strands of Patisiran siRNA. (A) Representative MS/MS spectra of the sense (left) and antisense (right) strands acquired using three different activation methods: CID (20 V), UVPD (1 laser pulse, 2 mJ), and EPD (1 laser pulse, 1 mJ + CID 20 V). (B) Ion-type distributions for each activation method show the relative contribution of different fragment series.
 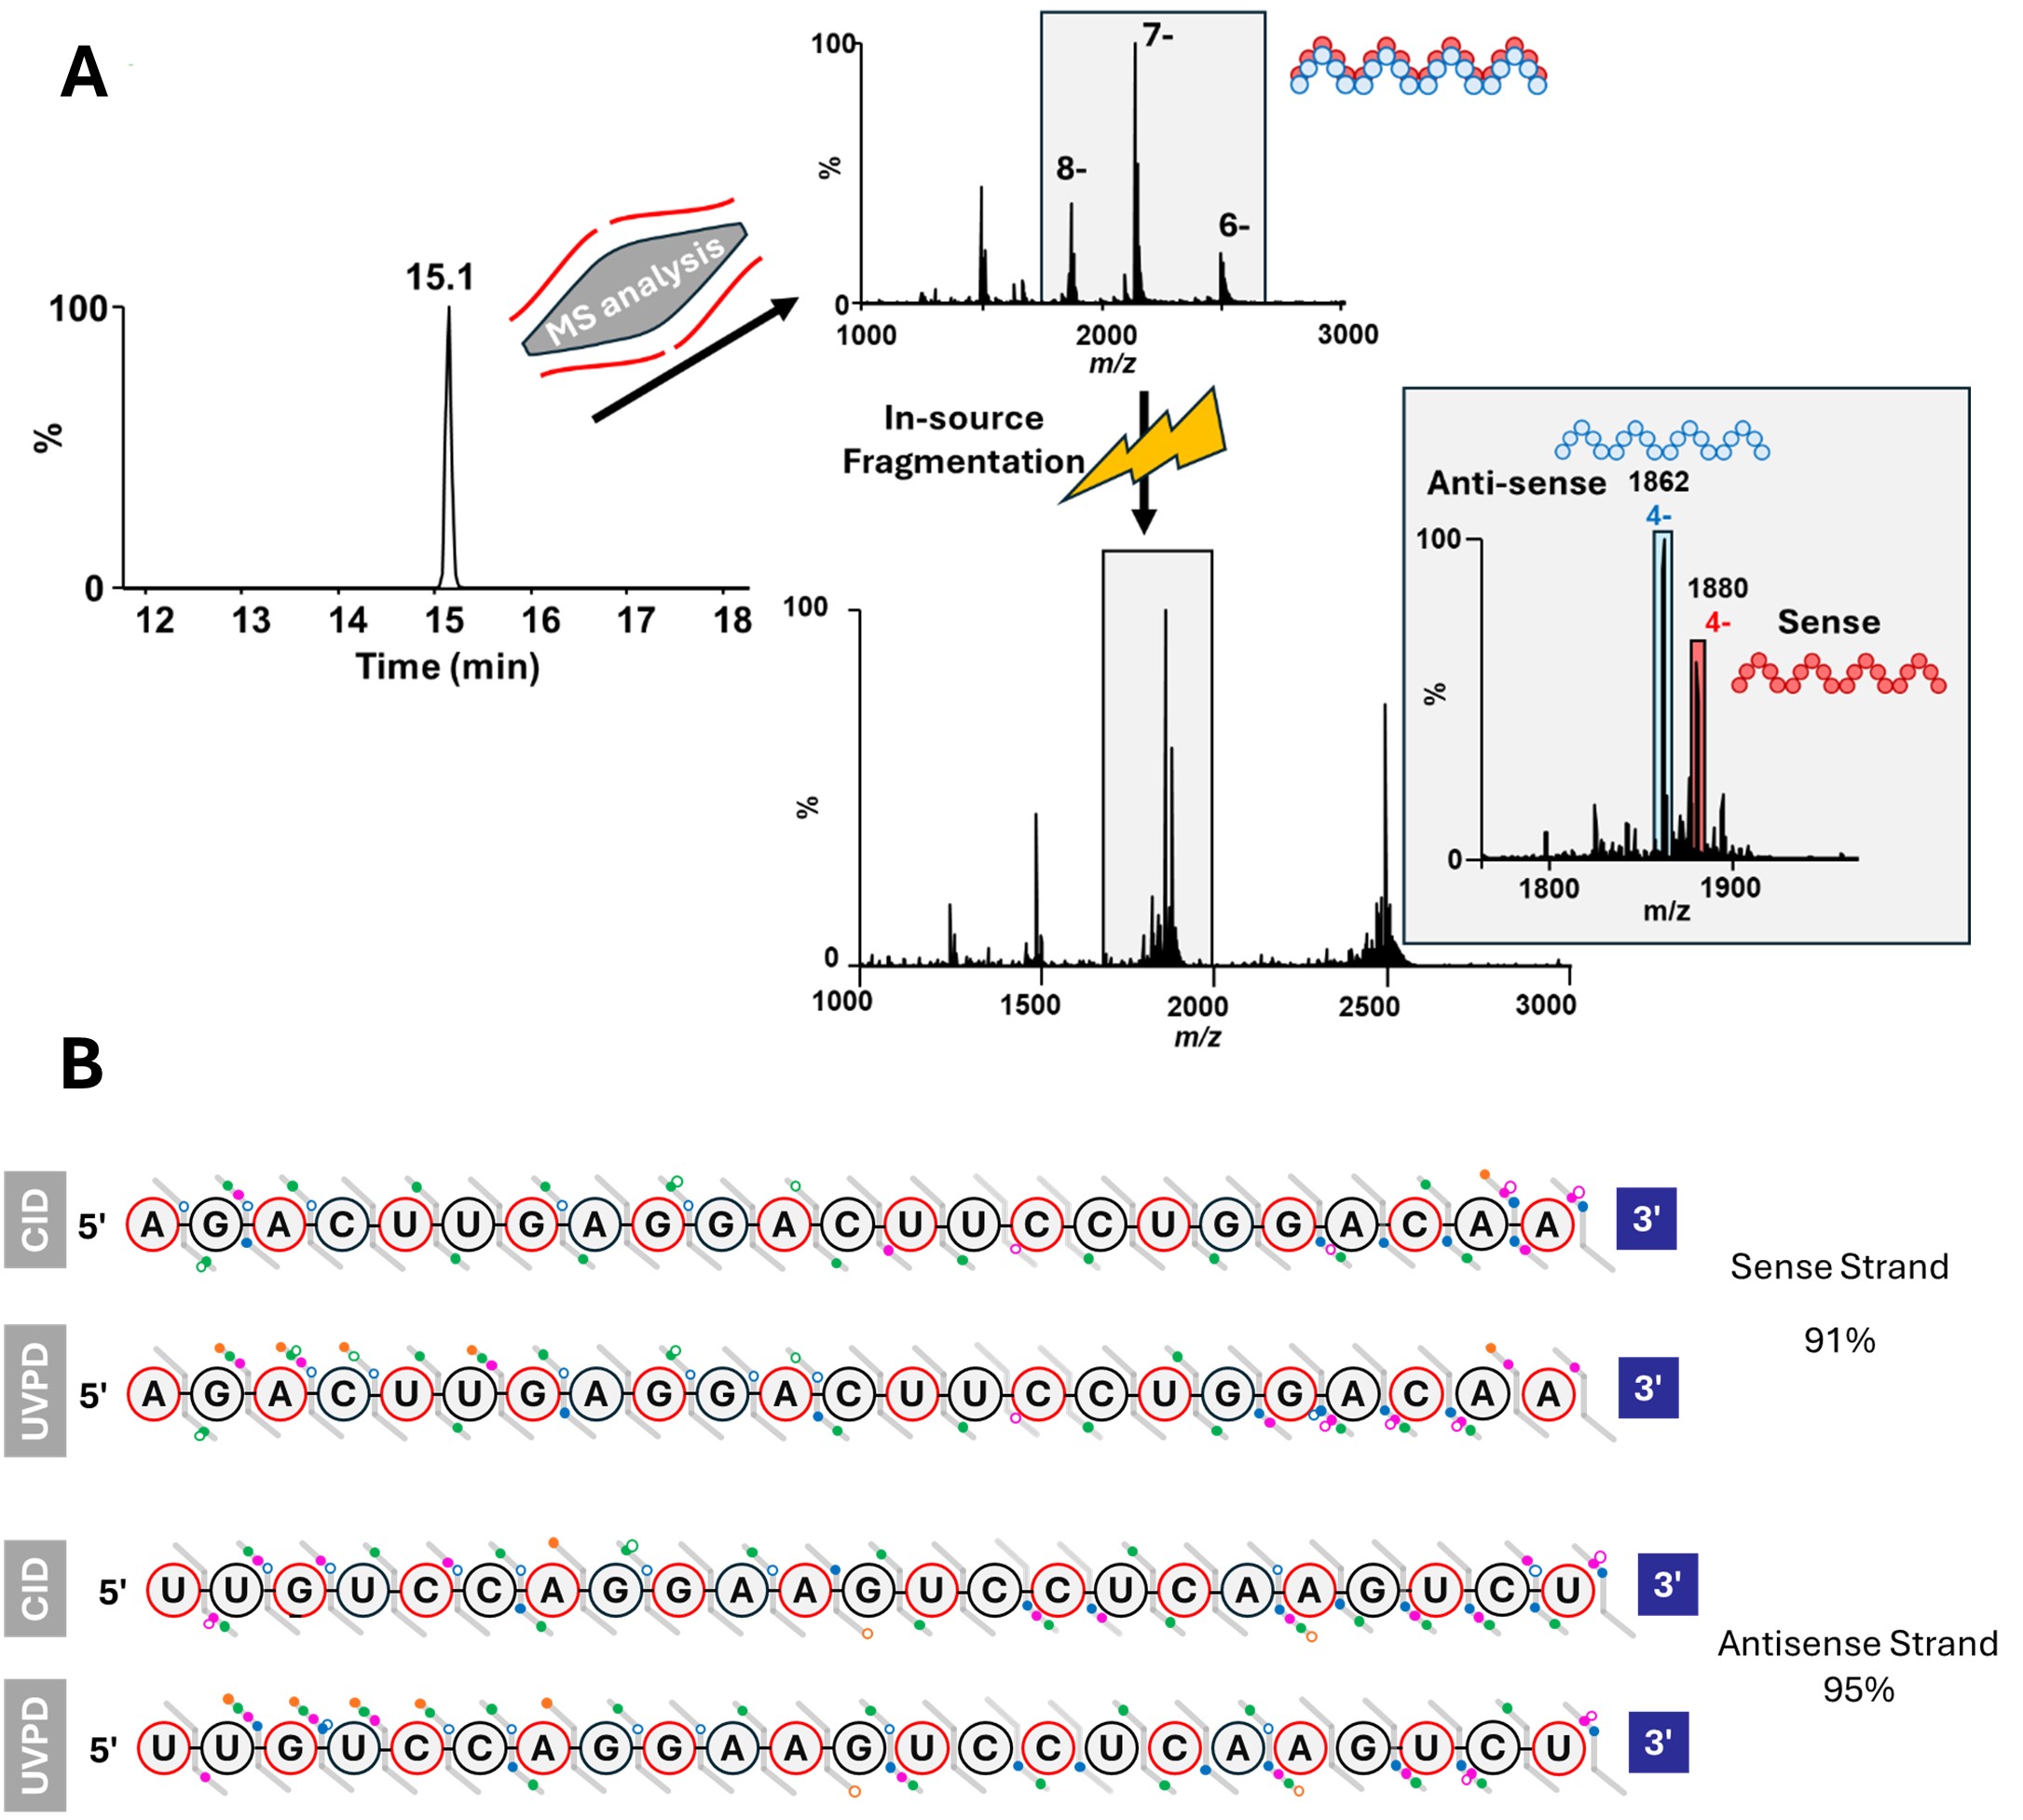 Figure 3. HILIC Separation of Duplex siRNA Enables Strand-Specific MS Analysis and High-Coverage Structural Characterization. (A) Extracted ion chromatogram showing a single peak at 15.1 min corresponding to intact duplex siRNA, preserved under native HILIC-MS conditions. In-source fragmentation was used to dissociate the duplex into its constituent sense and antisense strands followed by quadrupole isolation and identification of the individual RNA strands. (B) Combined CID and UVPD fragmentation maps show high sequence coverage of both strands.