
Manufacturing and Analytical Characterization - Chemical
 photo")
Miguel O. O. Jara, PhD (he/him/his)
Post-doc
Universidad de Chile
Santiago, Region Metropolitana, Chile
 photo")
Robert O. Williams, III, PhD (he/him/his)
Division Head, Molecular Pharmaceutics and Drug Delivery
University of Texas at Austin
Austin, Texas, United States
Beatriz V. Behrend, MS (she/her/hers)
Graduate Student
University of Texas at Austin
Austin, Texas, United States
Daniel A. Davis Jr., Ph.D.
Associate Principal Scientist
AustinPx
Georgetown, Texas, United States
Dave A. Miller, Ph.D.
Chief Scientific Officer
AustinPx
Georgetown, Texas, United States
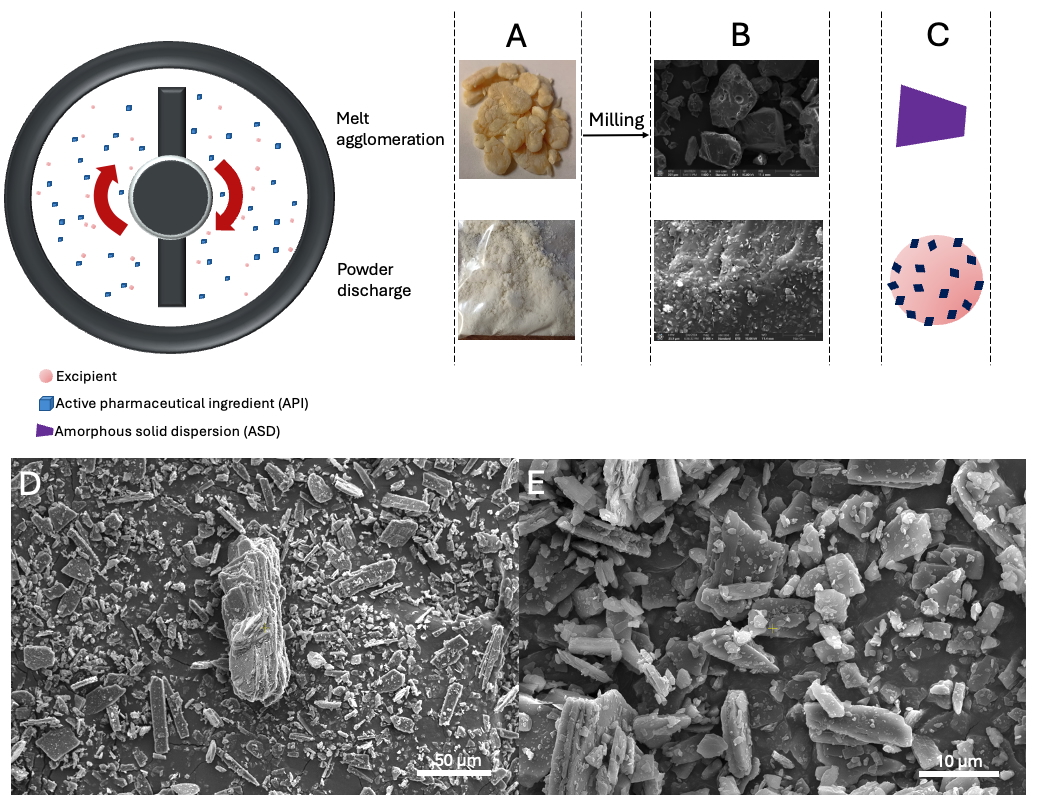 Figure 1. pKSD and KSD process diagrams, and (A) macroscopic, (B) SEM, and (C) schematic views of resulting materials. (D-E) SEM images showing the morphology of FBZ raw material.
 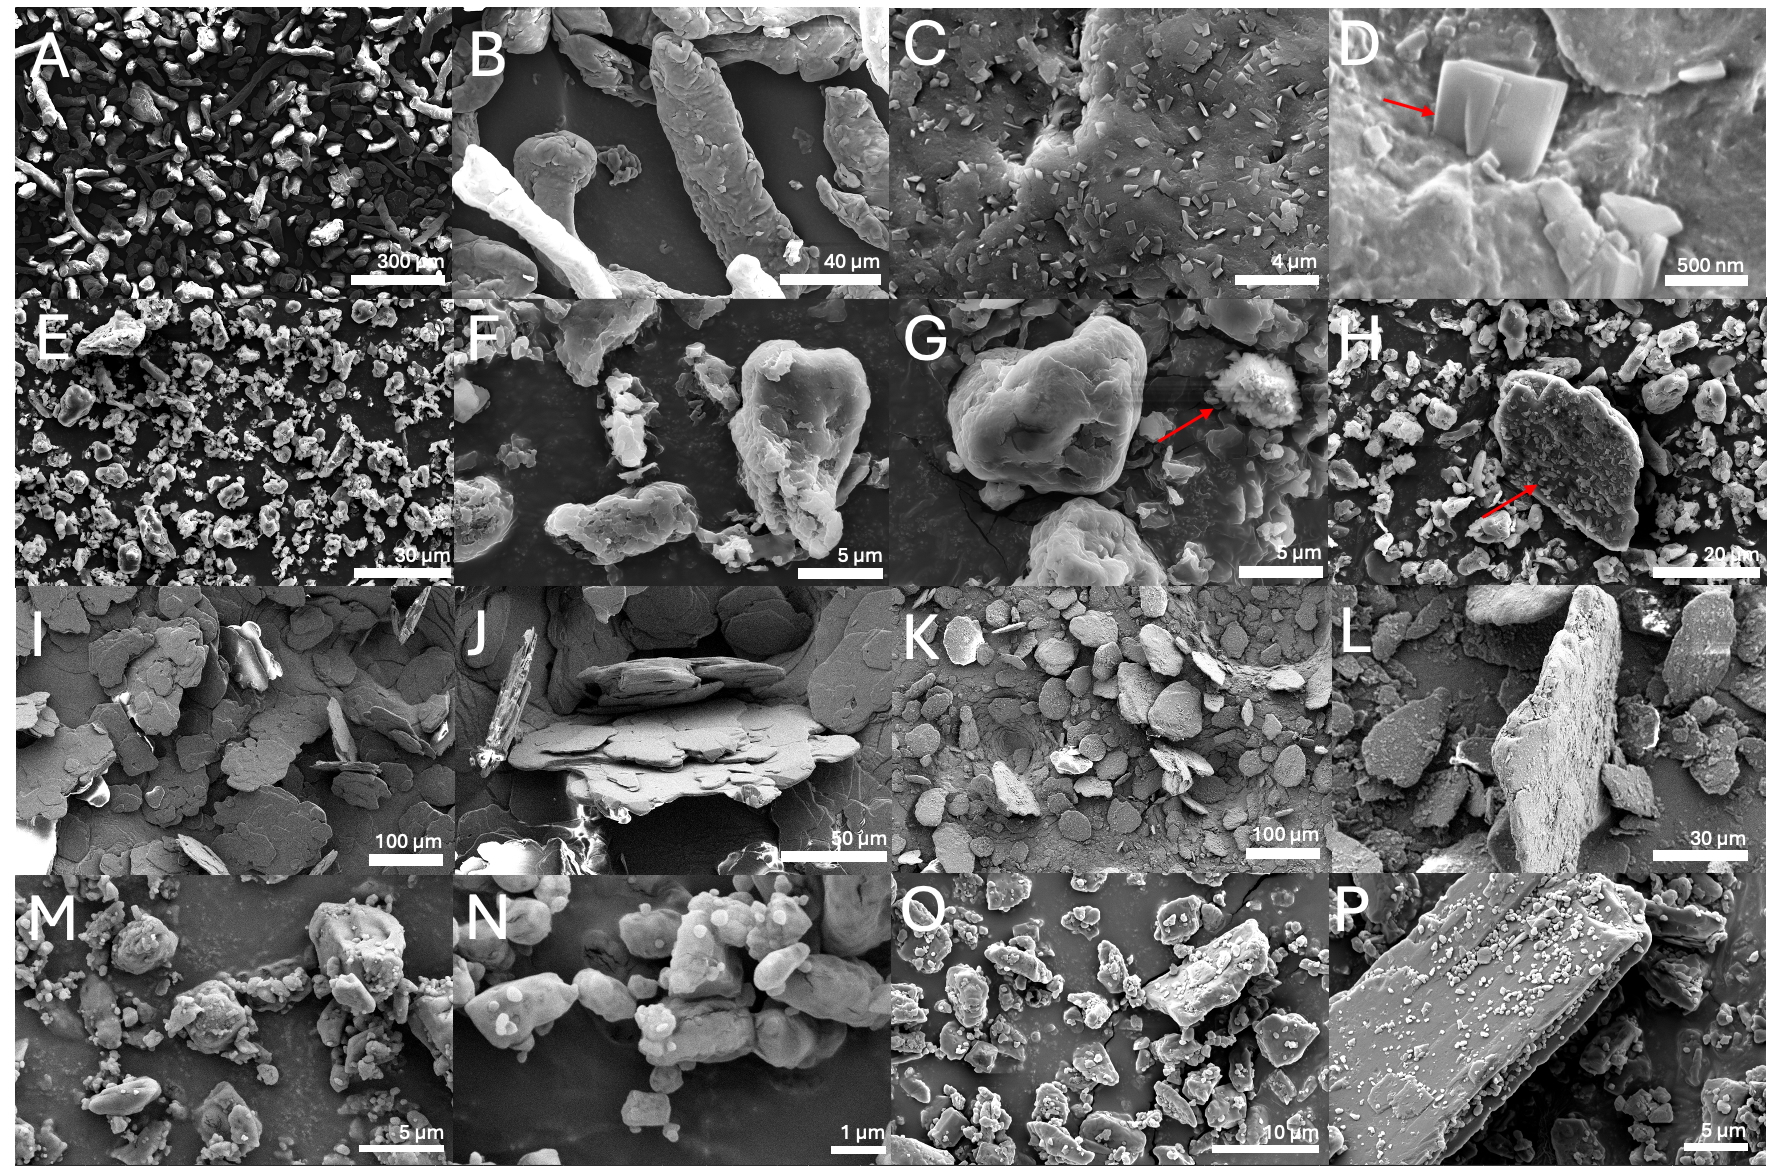 Figure 2. Scanning Electron Microscopy (SEM) images showing the morphology of: (A–B) HPMC; (C-D) FBZ-HPMC pKSD; (E–F) HPMCAS; (G-H) FBZ-HPMCAS pKSD, red arrows indicate the location of FBZ crystals; (I–J) leucine; (K-L) FBZ-leucine pKSD; (M-N) lactose; and (O-P) FBZ-lactose pKSD samples.
 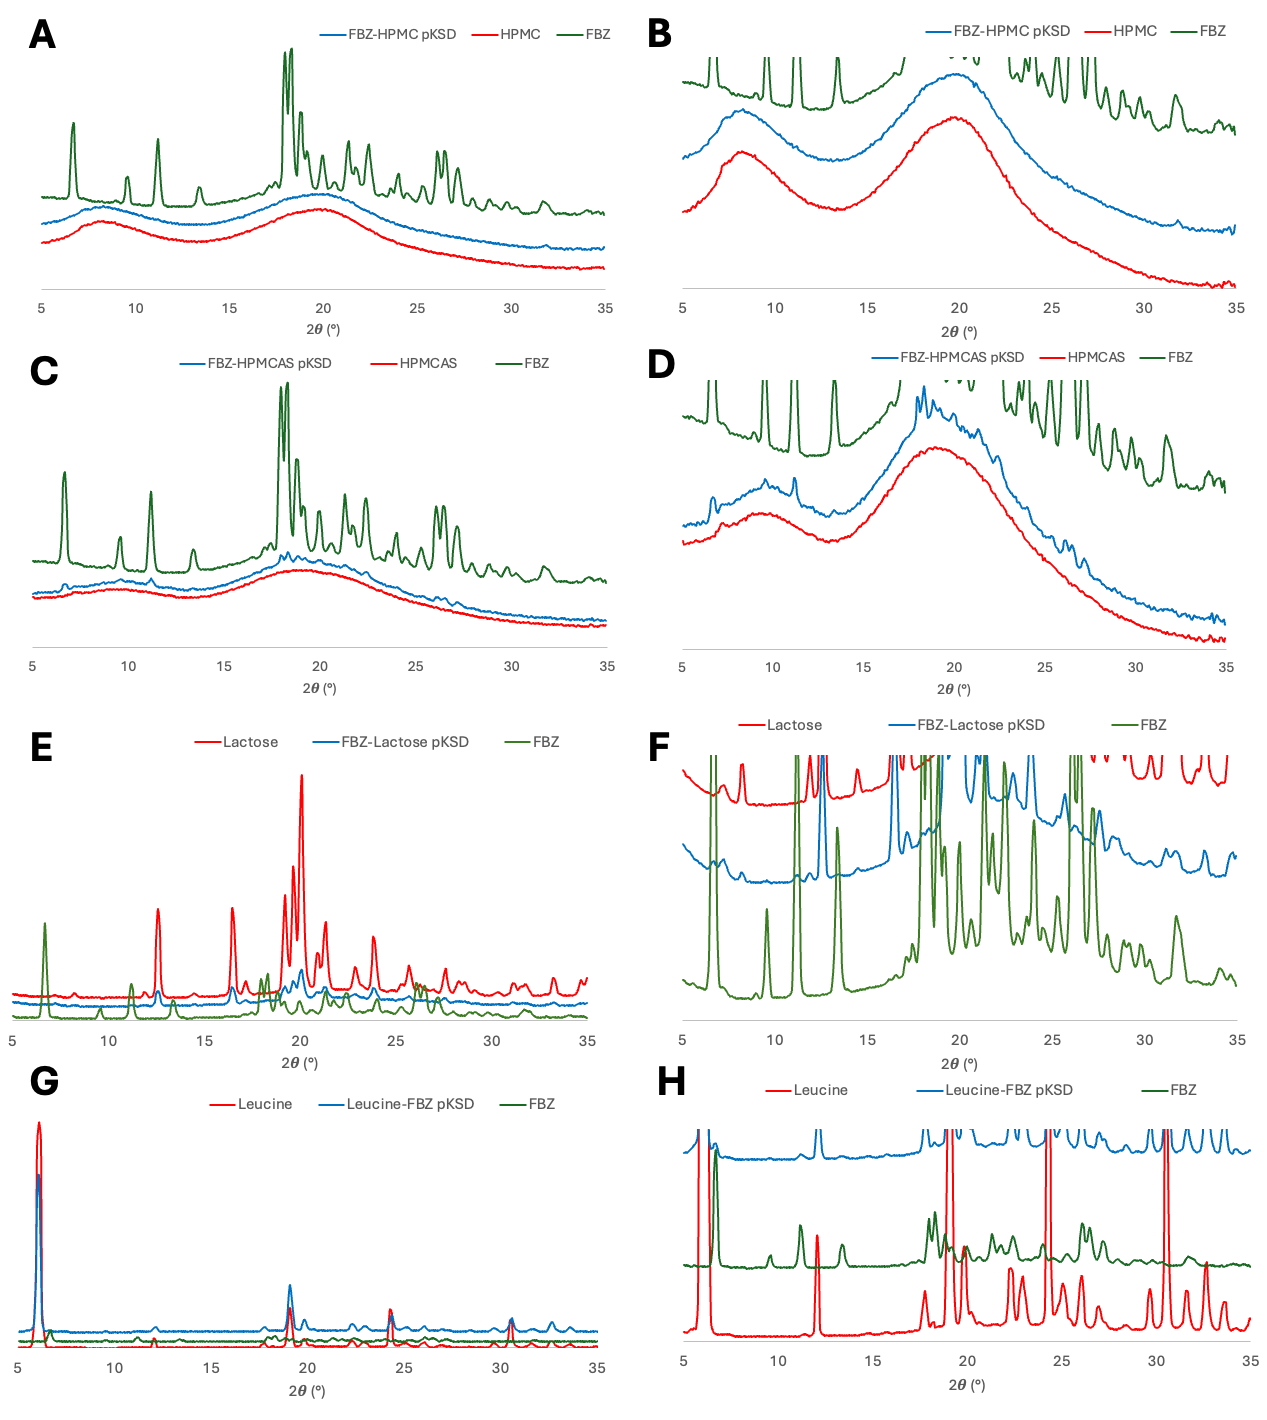 Figure 3. Wide-angle X-ray diffractogram of FBZ, excipients, and pKSD samples, including detailed close-up views. (A–B) FBZ-HPMC pKSD, (C–D) FBZ-HPMCAS pKSD, (E-F) FBZ-leucine pKSD, and (G-H) FBZ-lactose pKSD samples.