
Formulation and Delivery - Biomolecular
 photo")
Eman Kamel, PhD (she/her/hers)
Graduate Student
University of Iowa
Iowa City, Iowa, United States
Eman Kamel, PhD (she/her/hers)
Graduate Student
University of Iowa
Iowa City, Iowa, United States
Nidhi Thite, Ph.D.
Senior scientist
Merck & Co., Inc.
Boulevard, Colorado, United States
Sina Sarsarshahi, Ph.D.
Postdoctoral Research Scholar
University of Iowa
Iowa City, Iowa, United States

Christopher P. Calderon, Ph.D.
Researcher
University of Colorado
Boulder, Colorado, United States
Theodore Randolph, Ph.D.
professor
University of Colorado
Boulevard, Colorado, United States
Reza Nejadnik, PhD
Associate Professor
University of Iowa
Iowa City, Iowa, United States
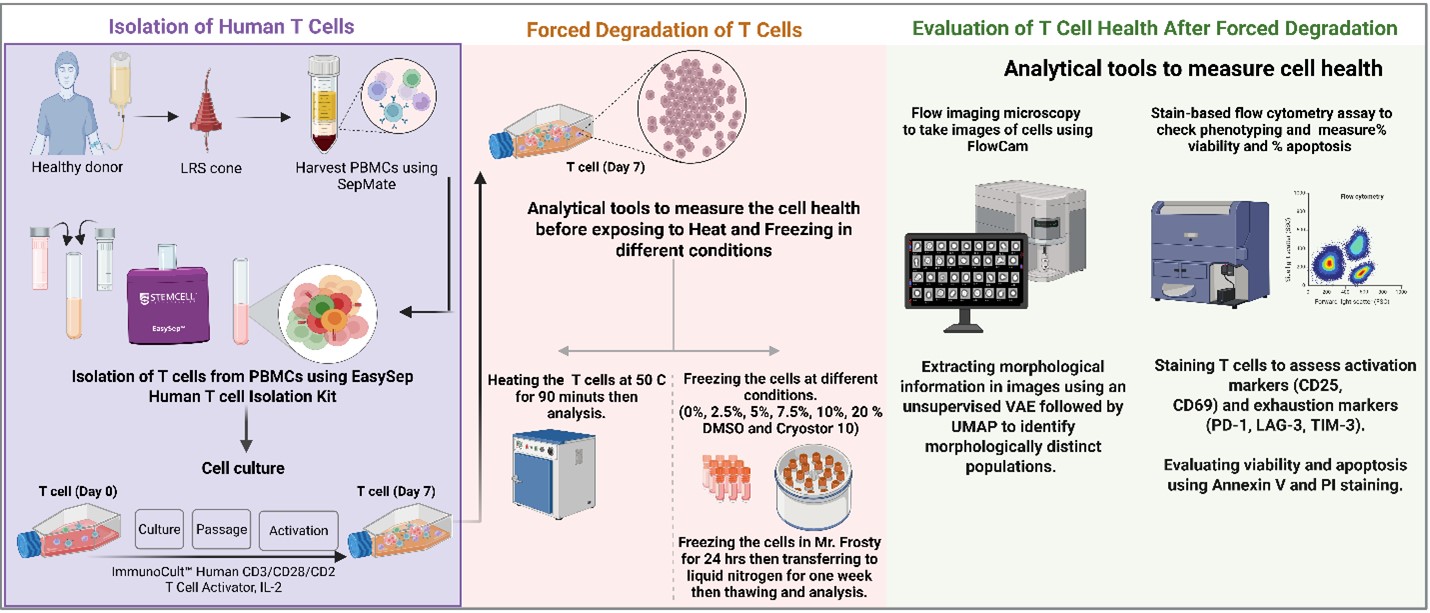 Figure 1. Isolation and enrichment of human T cells followed by forced degradation of T cell guided by flow imaging microscopy and flow cytometry.
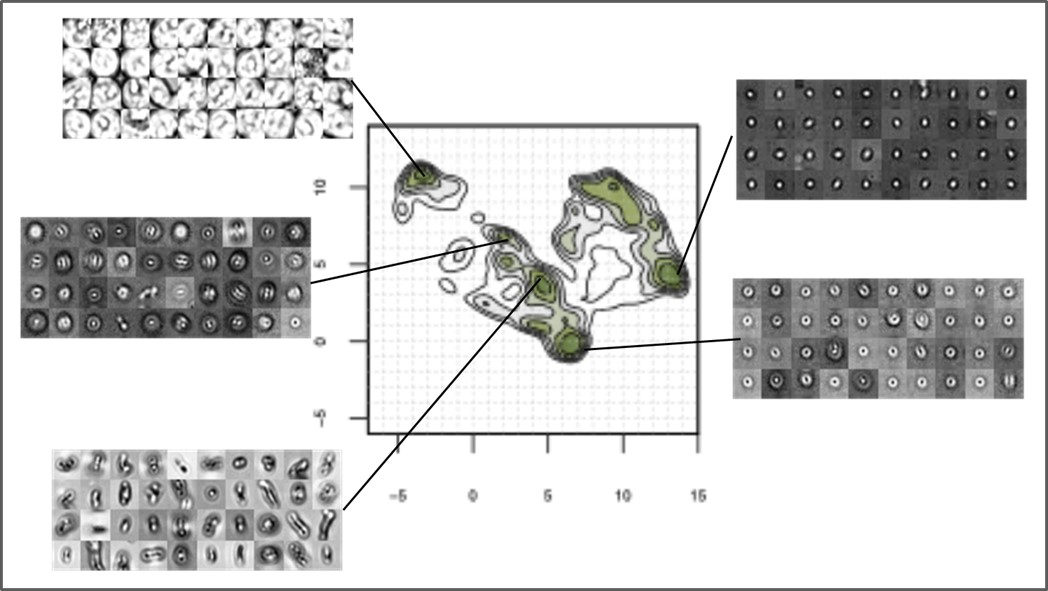 Figure 2. Density maps showing the 2d feature representations obtained using UMAP for the trained VAE model for images of T cells after heating stress. Regions of high density, indicated by darker shades of green, represent frequently observed cell morphologies, whereas lighter regions correspond to rarer morphological states.
 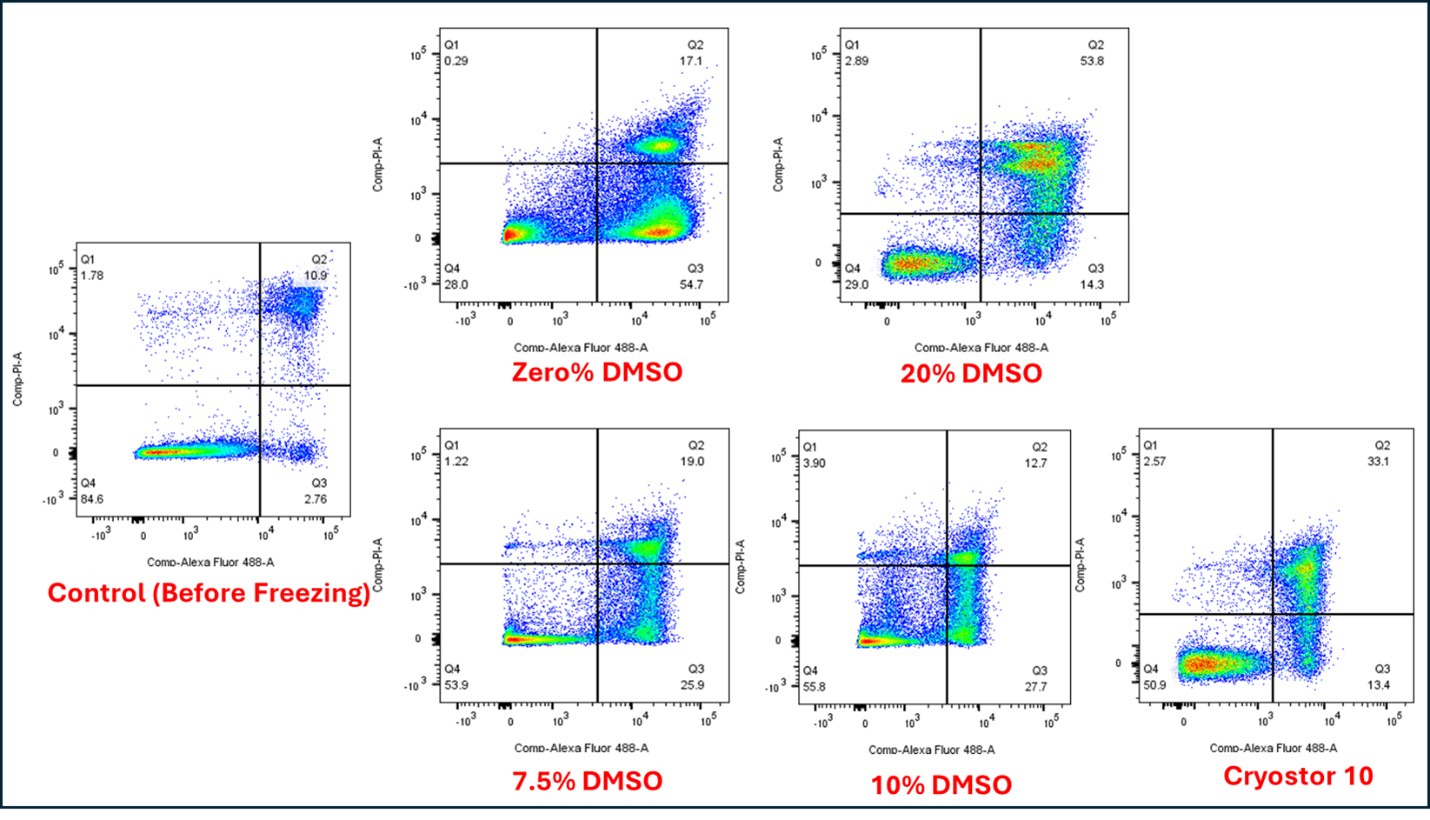 Figure 3. Overlay of flow cytometry density scatter plots of annexin V Alexafluor 488 versus PI for T cells at day 7 before freezing or heating and T cells after different freezing conditions with 0%, 7.5%, 10%, 20%, and CryoStor 10.