
Bioanalytics - Biomolecular
Viswanathan Gurumoorthy, Ph.D.
Postdoctoral Research Associate
Merck & Co., Inc.
West Point, Pennsylvania, United States
Viswanathan Gurumoorthy, Ph.D.
Postdoctoral Research Associate
Merck & Co., Inc.
West Point, Pennsylvania, United States
Marco A. Blanco, Ph.D.
Principal Scientist
Merck & Co., Inc.
West Point, Pennsylvania, United States
Suzette Pabit, Ph.D. (she/her/hers)
Associate Principal Scientist
Merck & Co., Inc.
West Point, Pennsylvania, United States
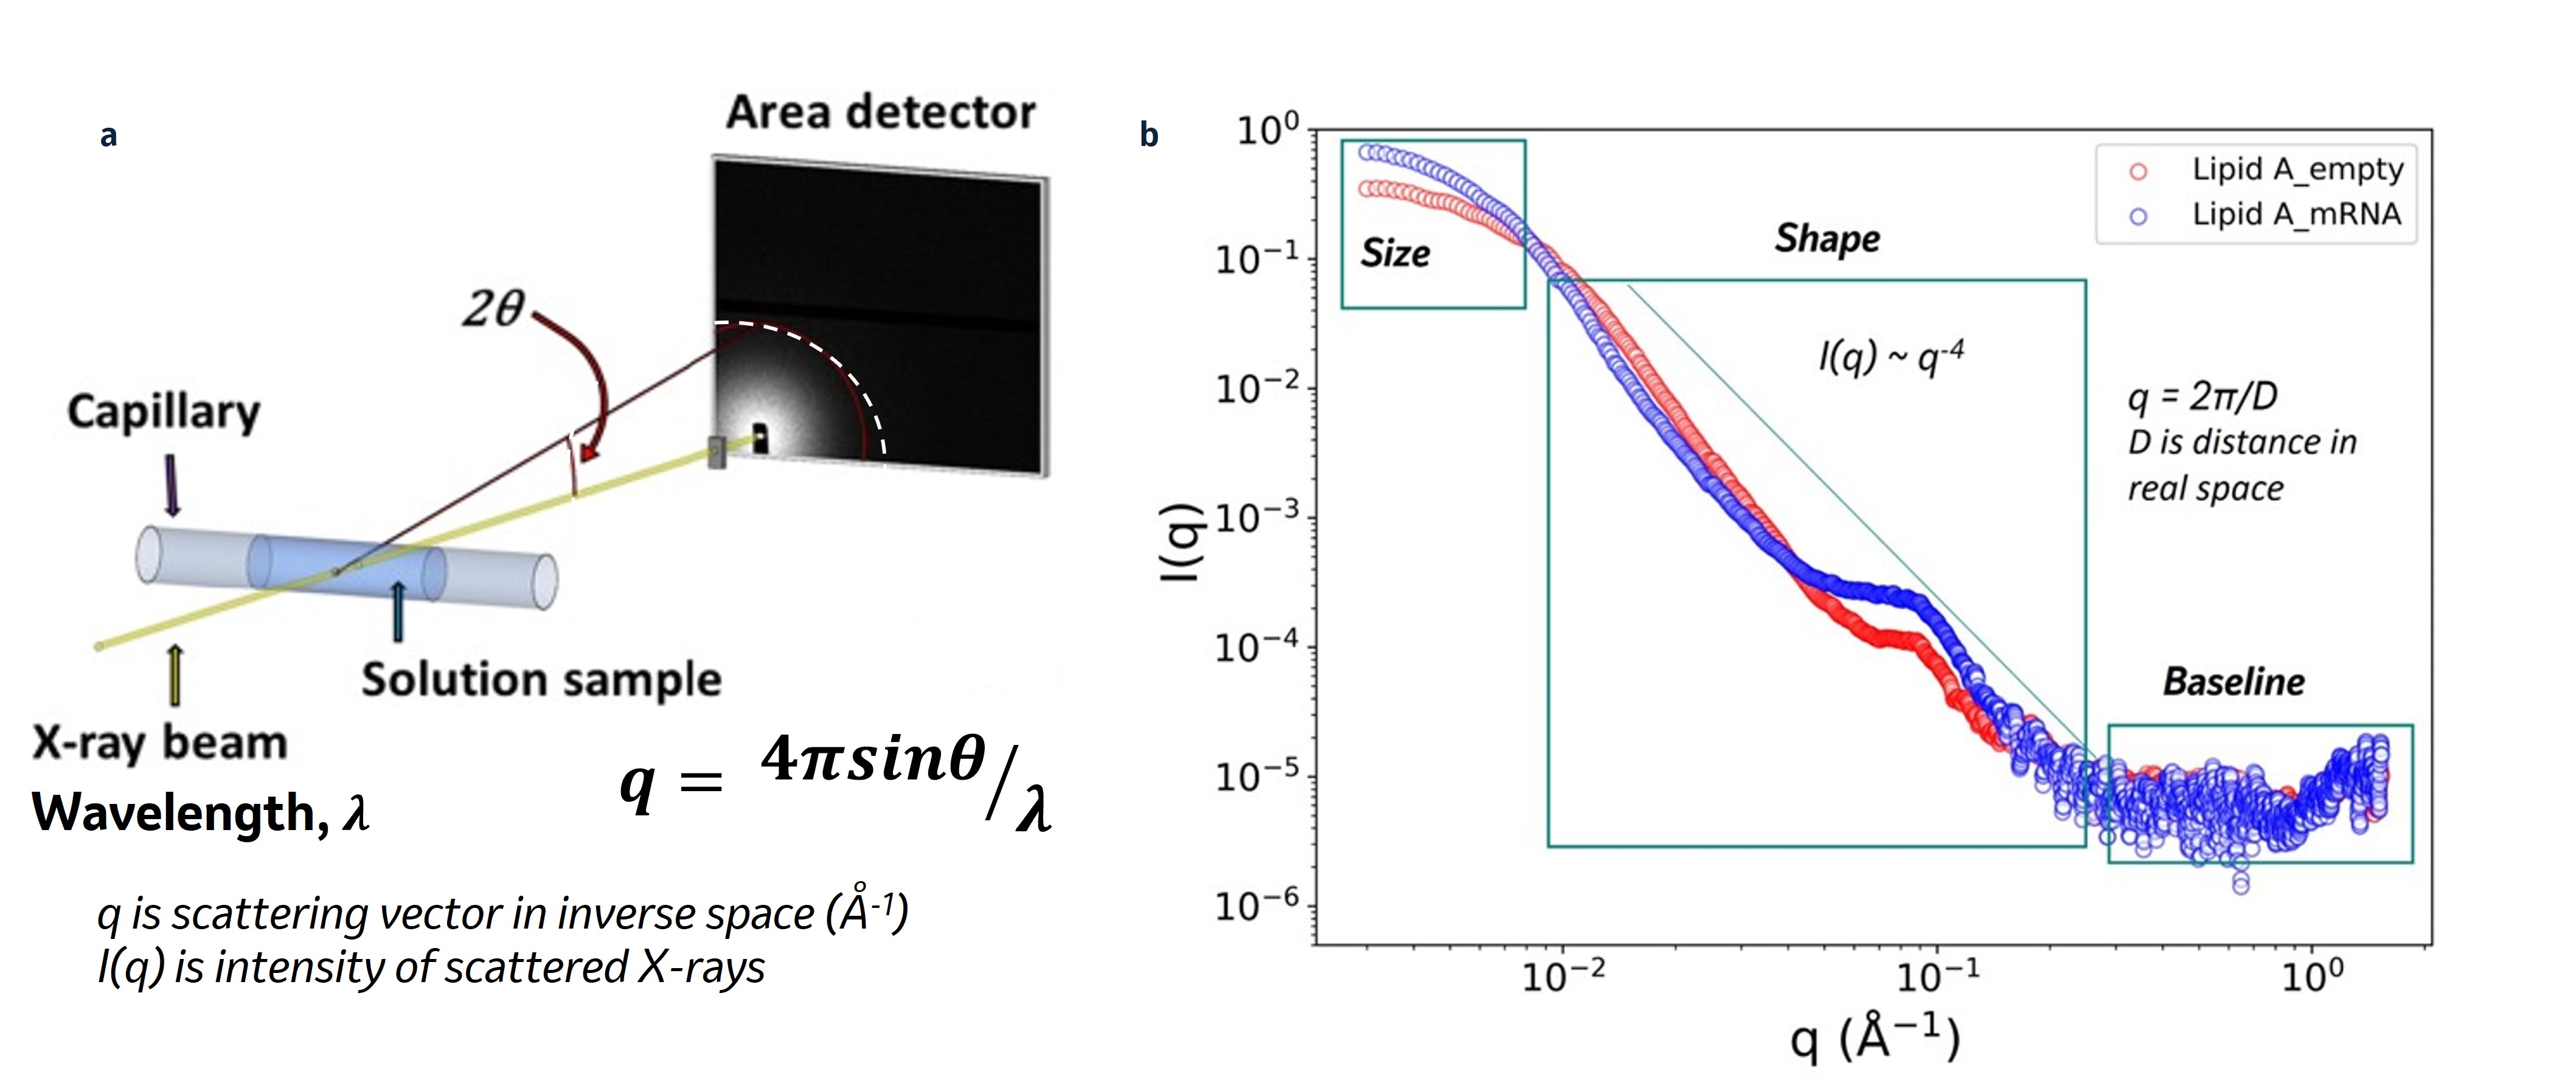 Figure 1. (a) SAXS experimental setup, adapted from [6], X-rays scattered from the sample in solution are collected in an area detector. The collected scattering intensity is radially integrated with respect to the main beam and reported as I(q) vs the scattering vector q (in Å-1) where q = (4π/)sin, is the X-ray wavelength and 2 the scattering angle. The SAXS profile, I(q) vs q, provides size and shape information about the sample. (b) SAXS profiles of empty and mRNA-loaded lipid A LNP normalized in terms of total lipid concentration. In the figure, we emphasized notable areas to look at to determine LNP size (at low q) and shape features (at mid q). The relationship q = 2π/D, where D is in real space, allows us to imagine the correlation of the scattering vector q to real space parameters.
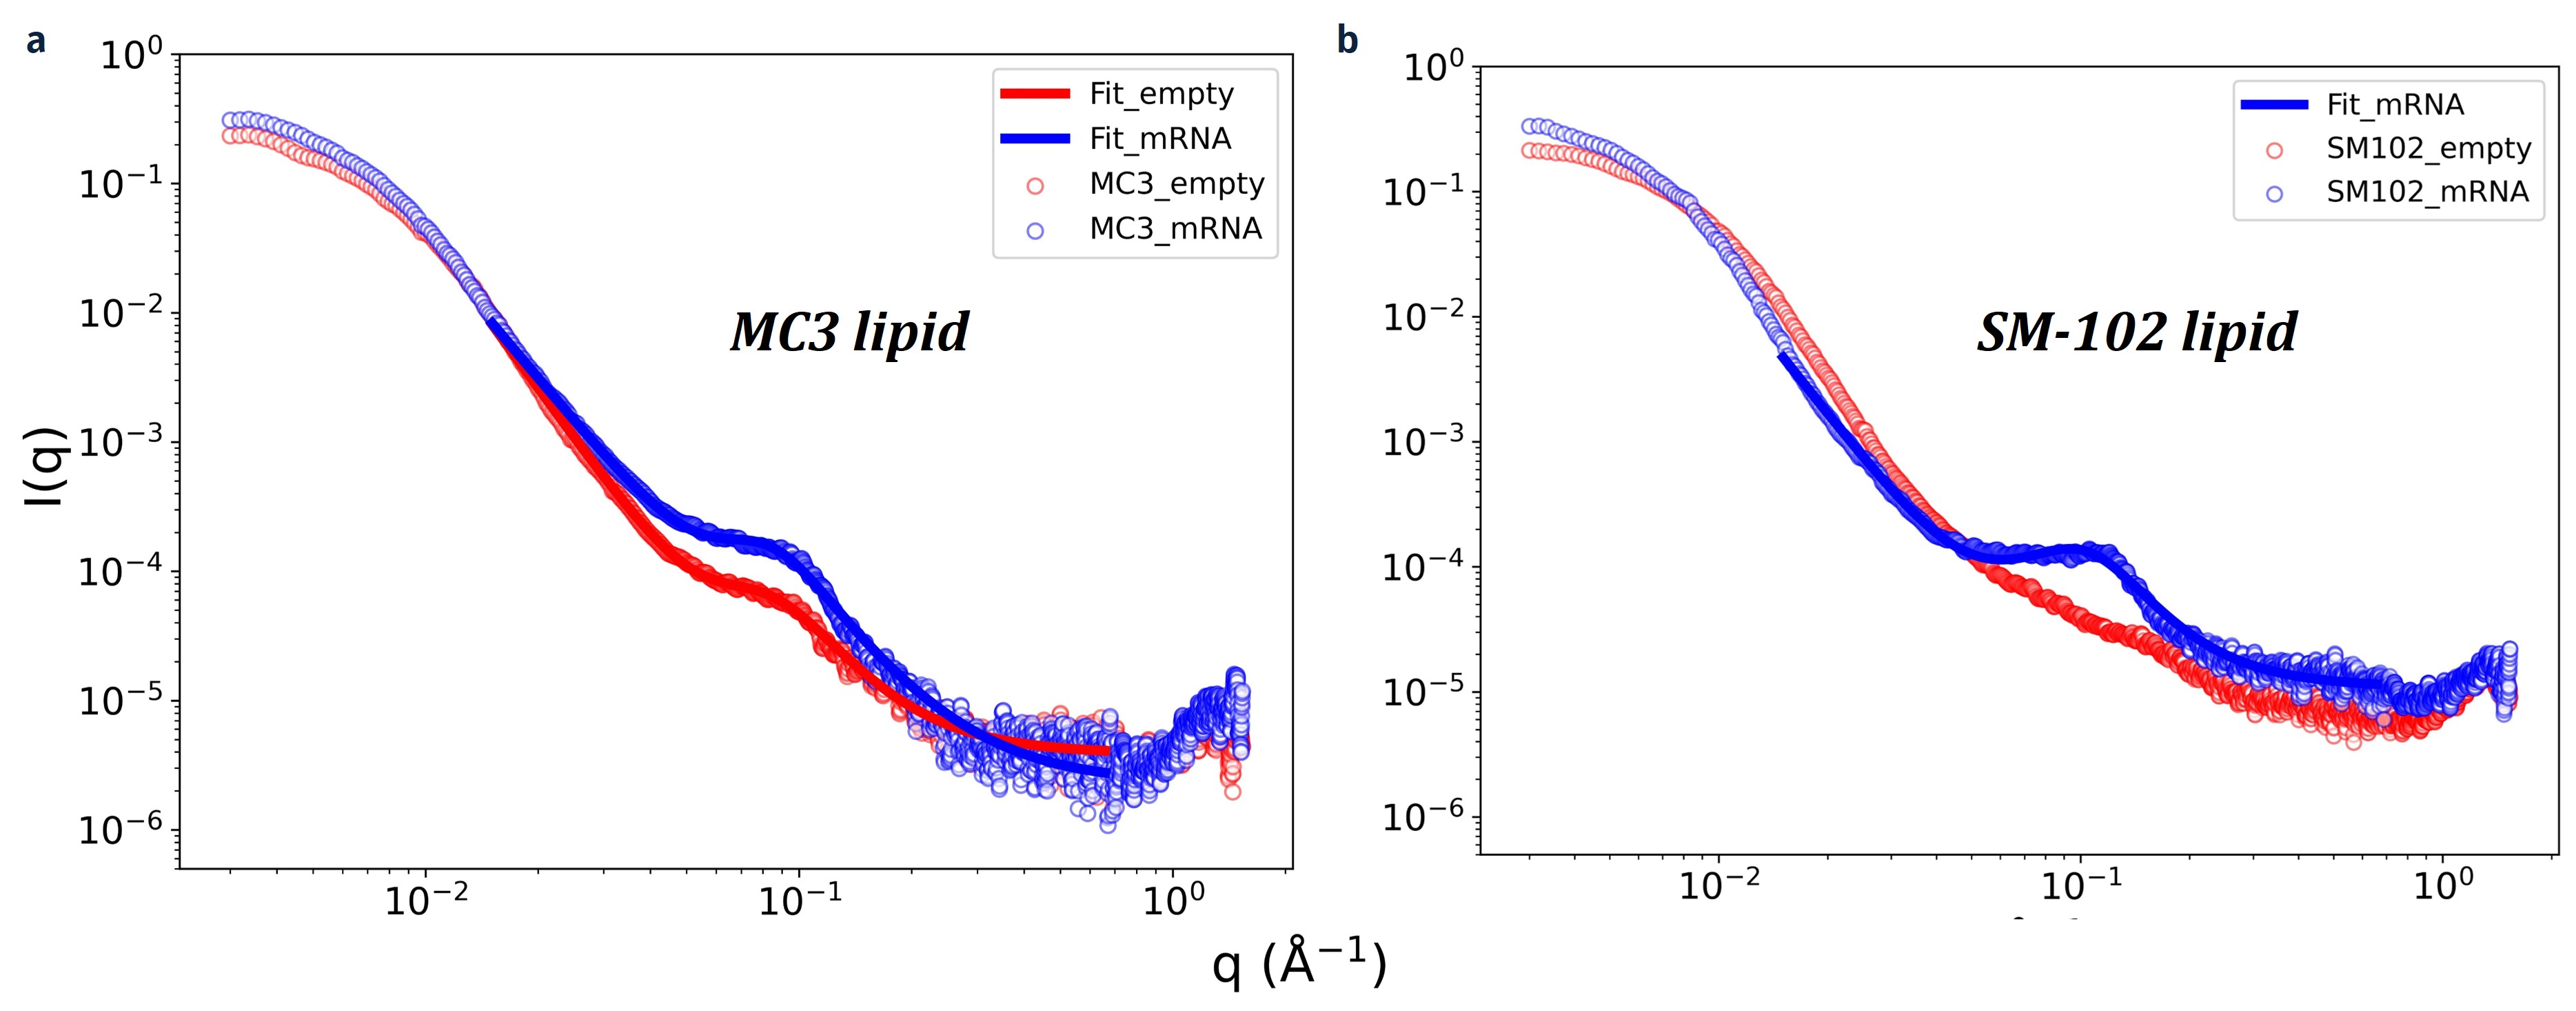 Figure 2. Representative SAXS profiles of (a) empty and mRNA-loaded MC3 LNPs and (b) empty and mRNA-loaded SM-102 LNPs. The solid lines represent the fits used to determine the Porod exponent, n, peak position, q0, and correlation length, ξ, as described in the Methods section. Note that for the empty LNP with SM-102, we did not fit the data as no peak can be observed.
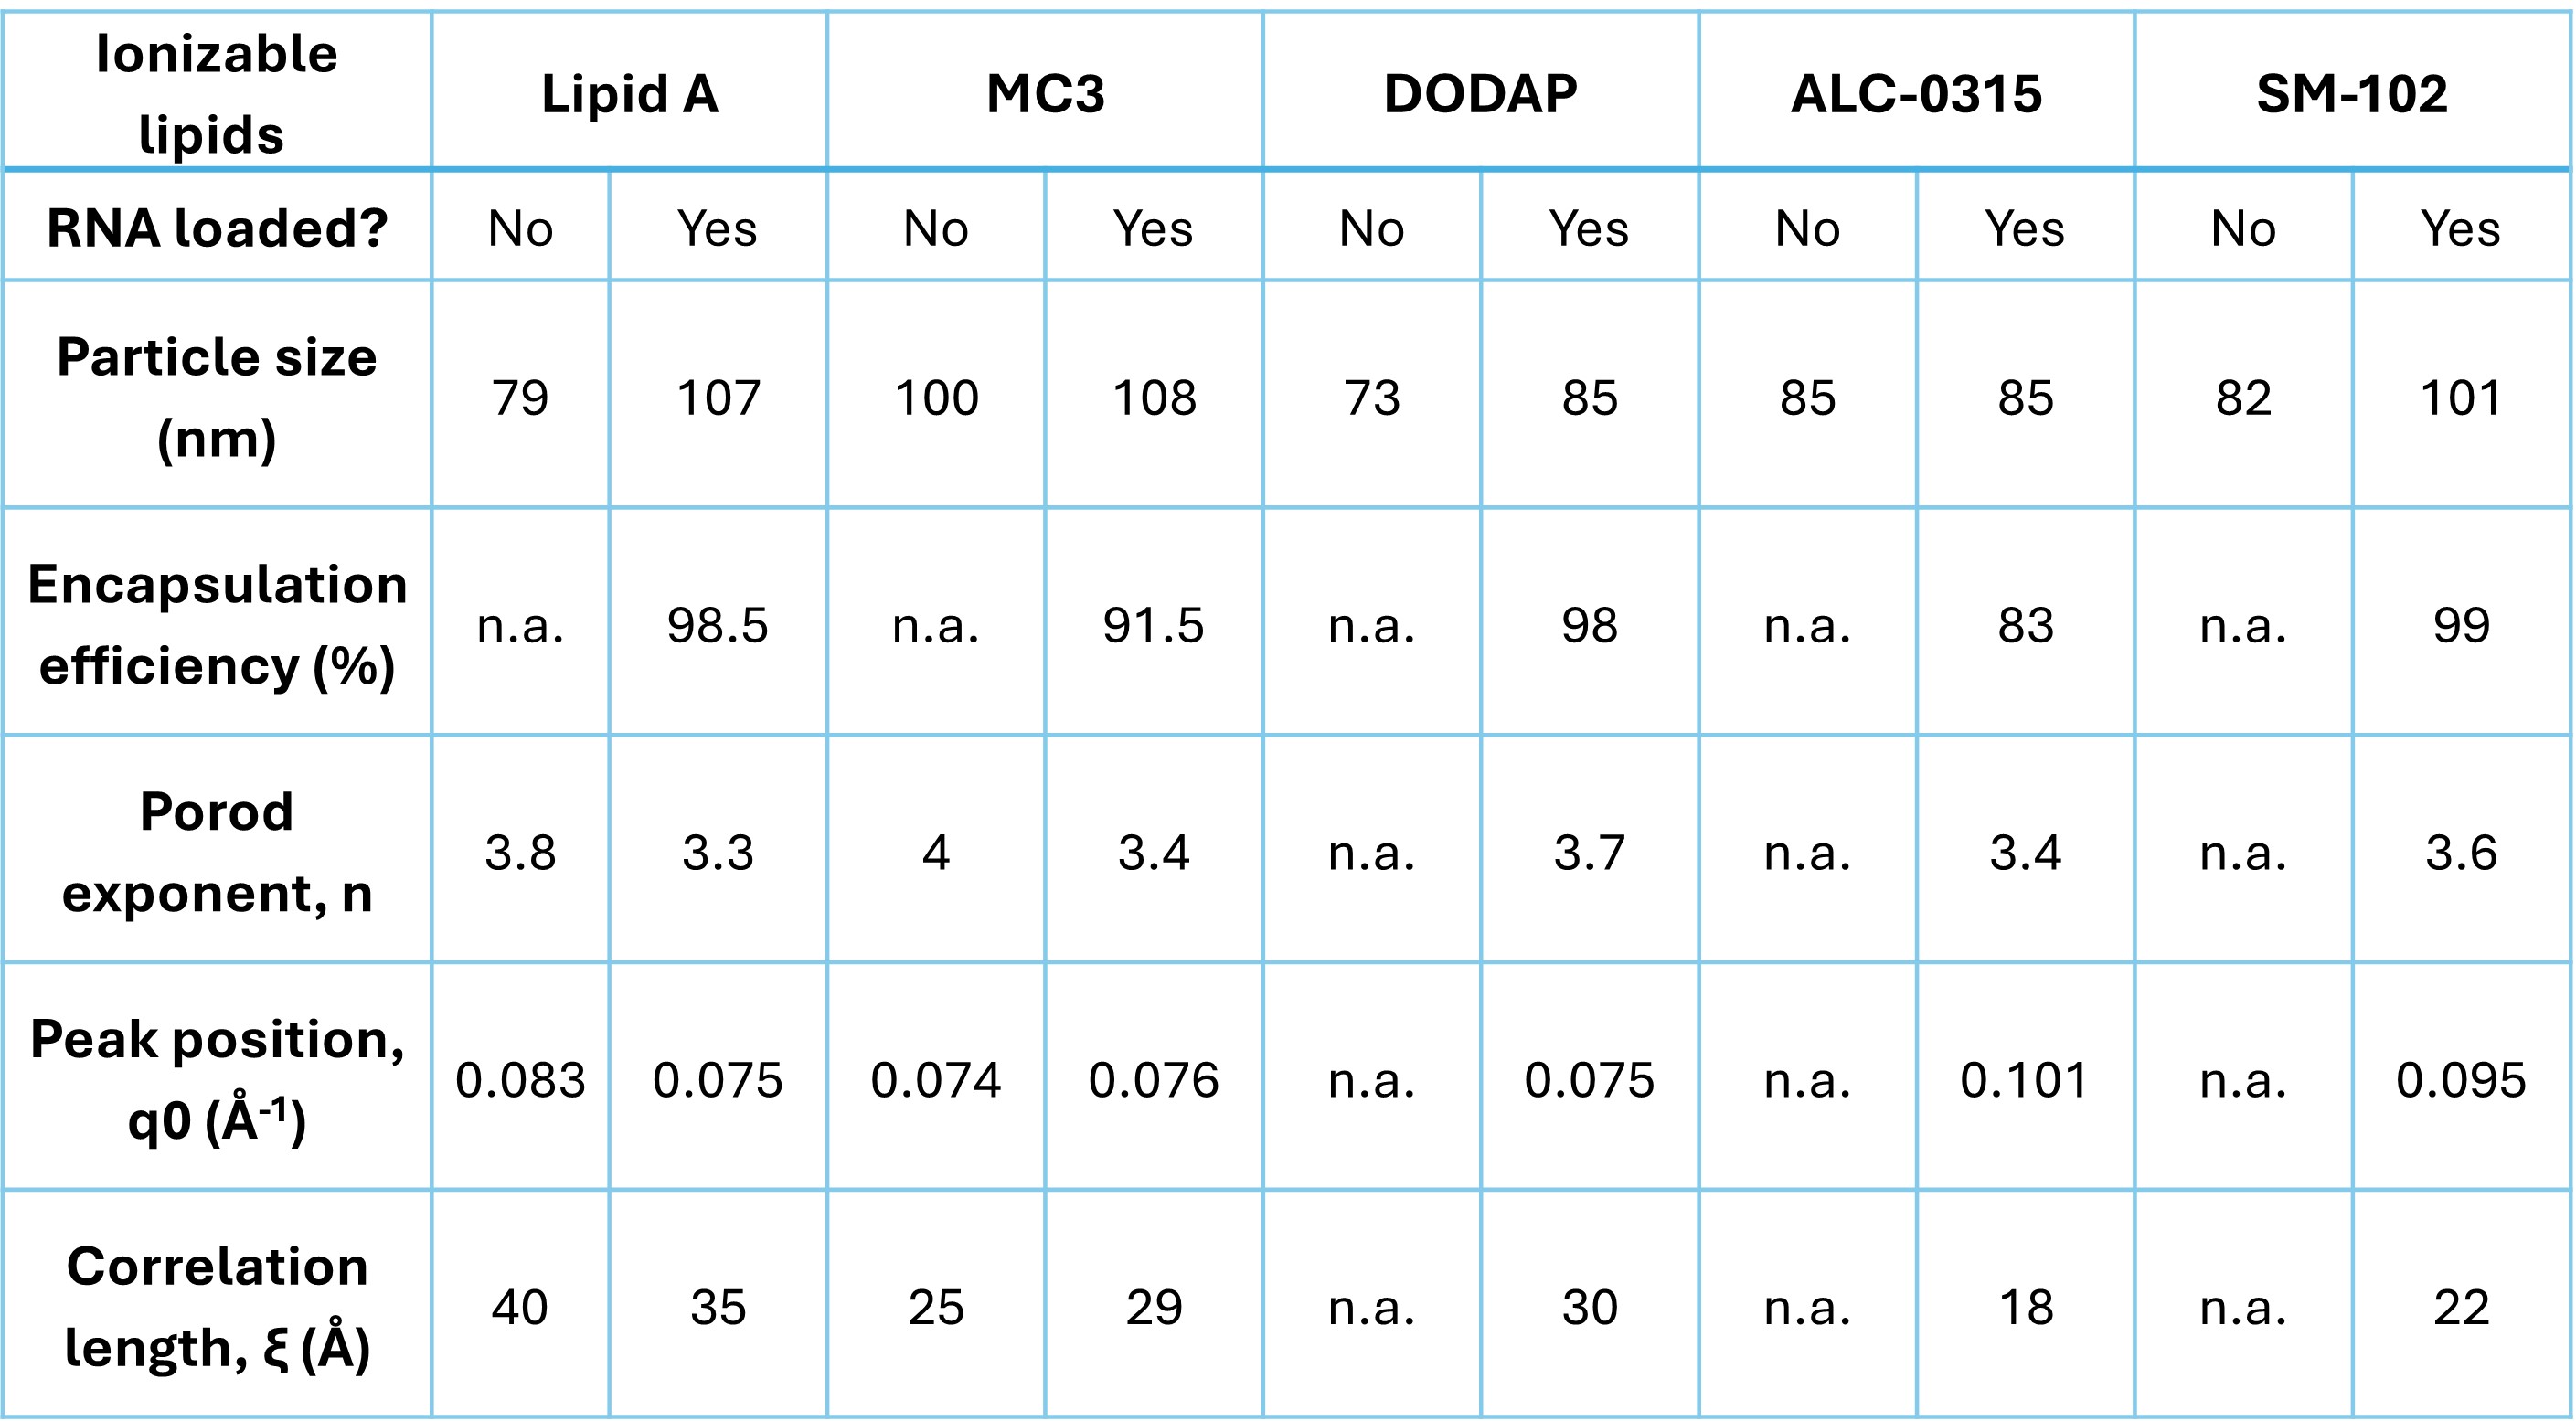 Table 1. Analytical measurements and results from the fitting as described in the Methods section. Encapsulation efficiency is not estimated for empty LNPs. Some empty LNPs do not exhibit a peak, and fitting is not performed. n.a. indicates not applicable or not calculated.