
Formulation and Delivery - Chemical
Maximo Pettarin, Ph.D.
PBPK Modeling Scientist
Simulations Plus, Inc.
Frankfurt Am Main, Hessen, Germany
Maximo Pettarin, Ph.D.
PBPK Modeling Scientist
Simulations Plus, Inc.
Frankfurt Am Main, Hessen, Germany
Jessica Spires, Ph.D.
Principal Scientist
Simulations Plus, Inc.
Bowie, Maryland, United States

Viera Lukacova, PhD
Chief Science Officer
Simulations Plus, Inc.
Research Triangle Park, North Carolina, United States
Adrian Williams, Ph.D.
Professor of Pharmaceutics
University of Reading
Berkshire, England, United Kingdom
Asma Sharkawy, Ph.D.
Research Associate
University of Bath
Somerset, England, United Kingdom
Annette L. L. Bunge, Ph.D.
Professor Emeritus, Research Professor
Colorado School of Mines
Golden, Colorado, United States

Richard H. H. Guy, PhD
Professor
University of Bath
Bath, England, United Kingdom

Priyanka Ghosh, Ph.D.
Lead Pharmacologist at Office of Research and Standards
US Food and Drug Administration
Maryland, Maryland, United States

Eleftheria Tsakalozou, Ph.D.
Team Lead, PBPK Locally acting drug product
US Food and Drug Administration
Silver Spring, Maryland, United States
M. Begoña B. Delgado Charro, Ph.D.
Professor
University of Bath
Bath, England, United Kingdom
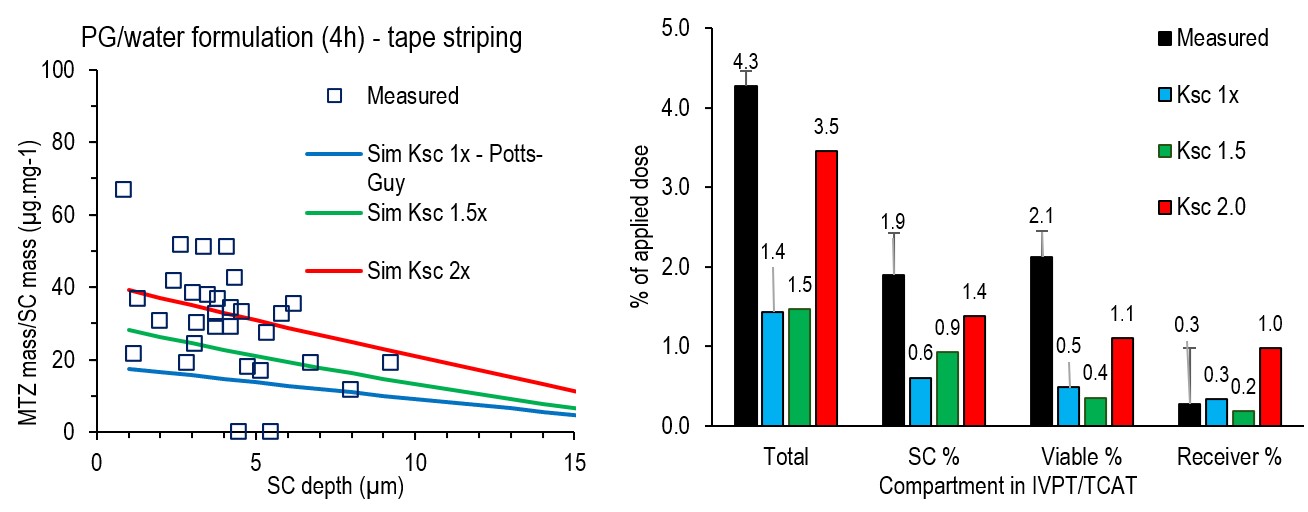 Figure 1. Simulations were compared with an IVPT study involving a 4-hour application of MTZ in a PG/water solution, performed using a standard Franz cell setup after application of the solution without occlusion (dose: 110µL/1.77cm2). Left: Measured () vs. Simulated (solids lines) at 1xKsc (Ksc predicted by the Potts-Guy equations-blue), 1.5xKsc (green) and 2xKsc (red) MTZ concentrations at different SC depths. Right: Measured (dark blue) vs. Simulated % of the applied dose delivered into the skin and into the different skin compartments at 1xKsc (blue), 1.5xKsc (green) and 2xKsc (red).
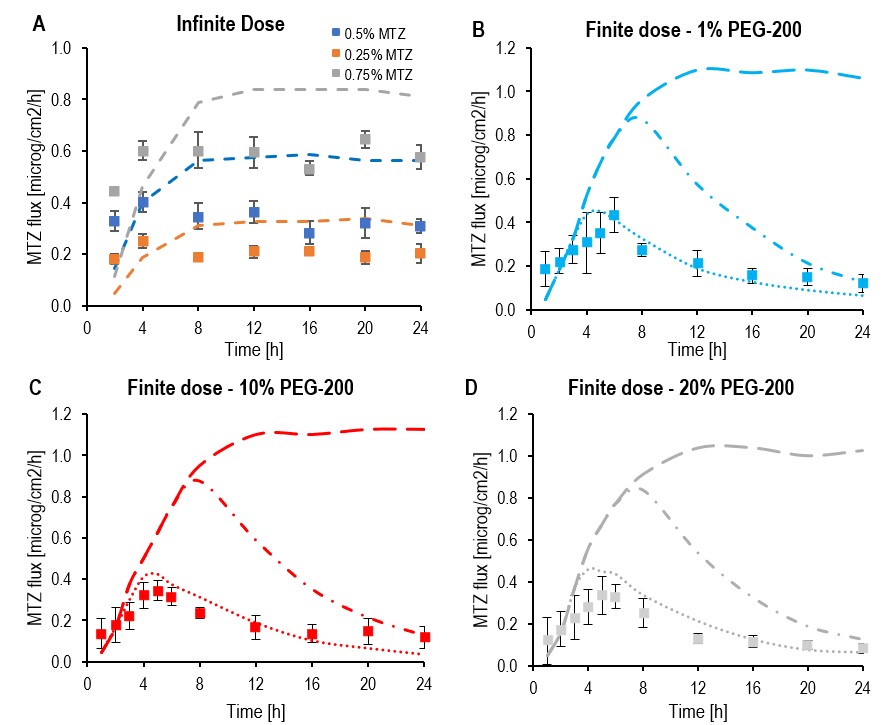 Figure 2. Simulations compared with IVPT study of 24 h applications of MTZ in PEG200:HEC in a stadard Franz-cell setup. A: Measured (□) vs. simulated (dashed) MTZ flux profiles from PEG200:HEC gels at different doses under infinite dosing (dose: 2mL/cm2). B, C, D: Measured (□) MTZ flux from 0.5% MTZ HEC gels with (B) 1%, (C) 10%, (D) 20% PEG200 under finite dosing (300µL/cm2) vs. simulated profiles at (dashed) 24-h, (dash-dotted) 6-h, and (dotted) 2-h application times.