
Bioanalytics - Biomolecular
Alexa Boyle, MS
Lead Scientist
Labcorp
Chantilly, Virginia, United States
Alexa Boyle, MS
Lead Scientist
Labcorp
Chantilly, Virginia, United States
Angelika Grinshpun
Method Development Scientist
Labcorp
Chantilly, Virginia, United States
Sarah Eakhurst
Method Development Scientist
Labcorp
Harrogate, England, United Kingdom
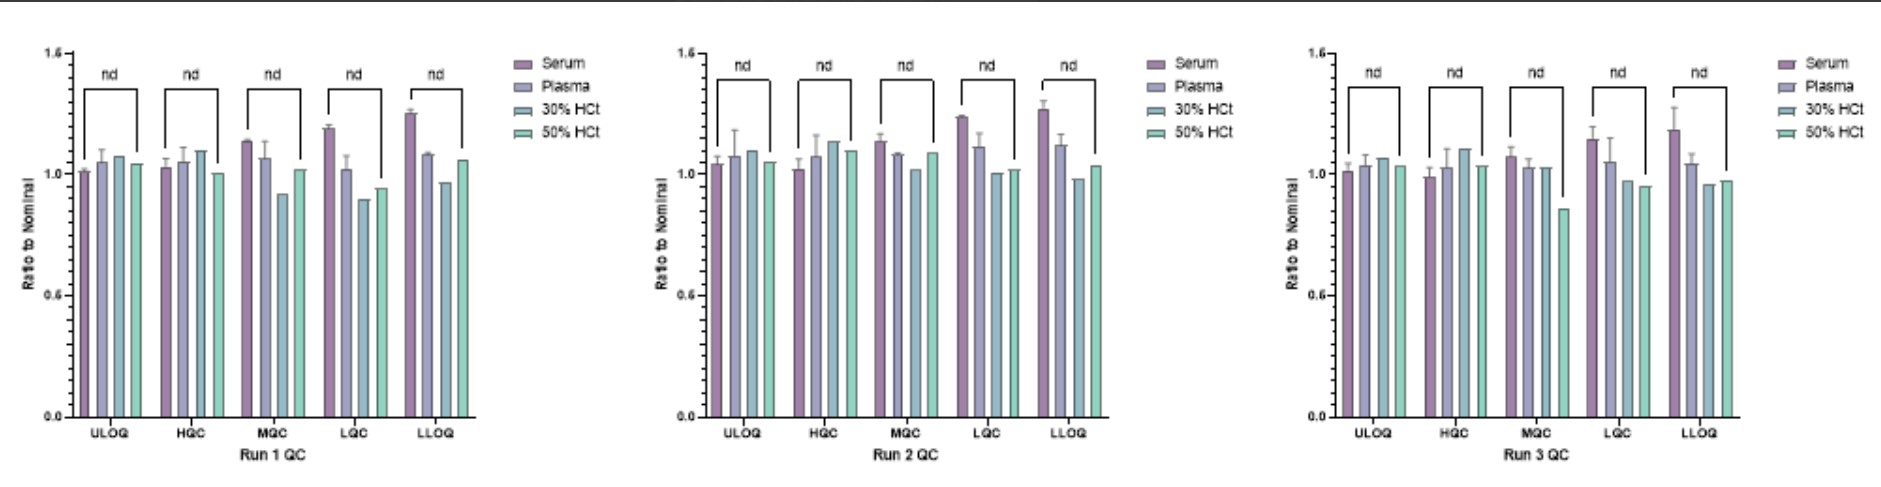 Figure 1: Comparability shown between 5 quality controls (concentrations 90 ng/mL (LLOQ), 150 ng/mL (LQC), 800 ng/mL (MQC), 2200 ng/mL (HQC) and 3000 ng/mL (ULOQ)) prepared in human serum, K2EDTA human plasma and human whole blood (30 and 50% Hct) using Mitra® tips and assessed against a human serum calibration curve. The ratio to normal was calculated for each QC level against the human serum QC result across all 3 runs. An unpaired t-test was used to calculate significant difference for each matrix type and performed independently per run. Abbreviations: nd = no difference
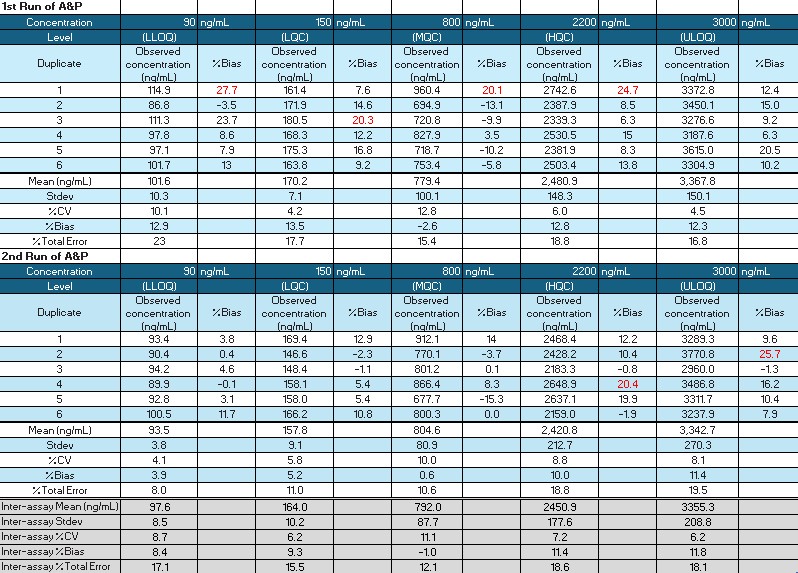 Table 1: Two runs of accuracy and precision were performed under the optimized elution buffer and drying time conditions for the 5 quality controls (concentrations 90, 150, 800, 2200 and 3000 ng/mL) prepared in whole blood using Mitra® tips. The red text for % Bias indicates that the parameter is outside the acceptance criteria: LLOQ and ULOQ < +25%, LQC/MQC/HQC < +20%.
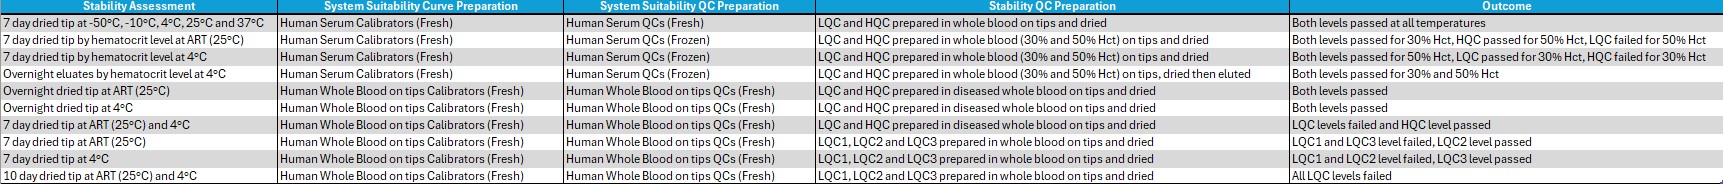 Table 2: Summary table of stability assessments performed with outcome.