
Formulation and Delivery - Chemical

Mohammad Alnatour, PhD
Postdoctoral Research Scholar
University of Iowa
Iowa City, Iowa, United States
Mohammad Alnatour, PhD
Postdoctoral Research Scholar
University of Iowa
Iowa City, Iowa, United States
Pornpoj Phruttiwanichakun, Pharm.D., M.Sc. (they/them/theirs)
Graduate student
University of Iowa
Iowa City, Iowa, United States
Sean Geary, Ph.D.
Assistant Research Scientist/Lab Manager
University of Iowa
Iowa City, Iowa, United States
Sen Ramkrishna, Ph.D.
Postdoctoral researcher
University of Iowa
Iowa City, Iowa, United States

Aliasger K. Salem, PhD
Bighley Chair and Professor of Pharmaceutical Sciences
University of Iowa
Iowa City, Iowa, United States
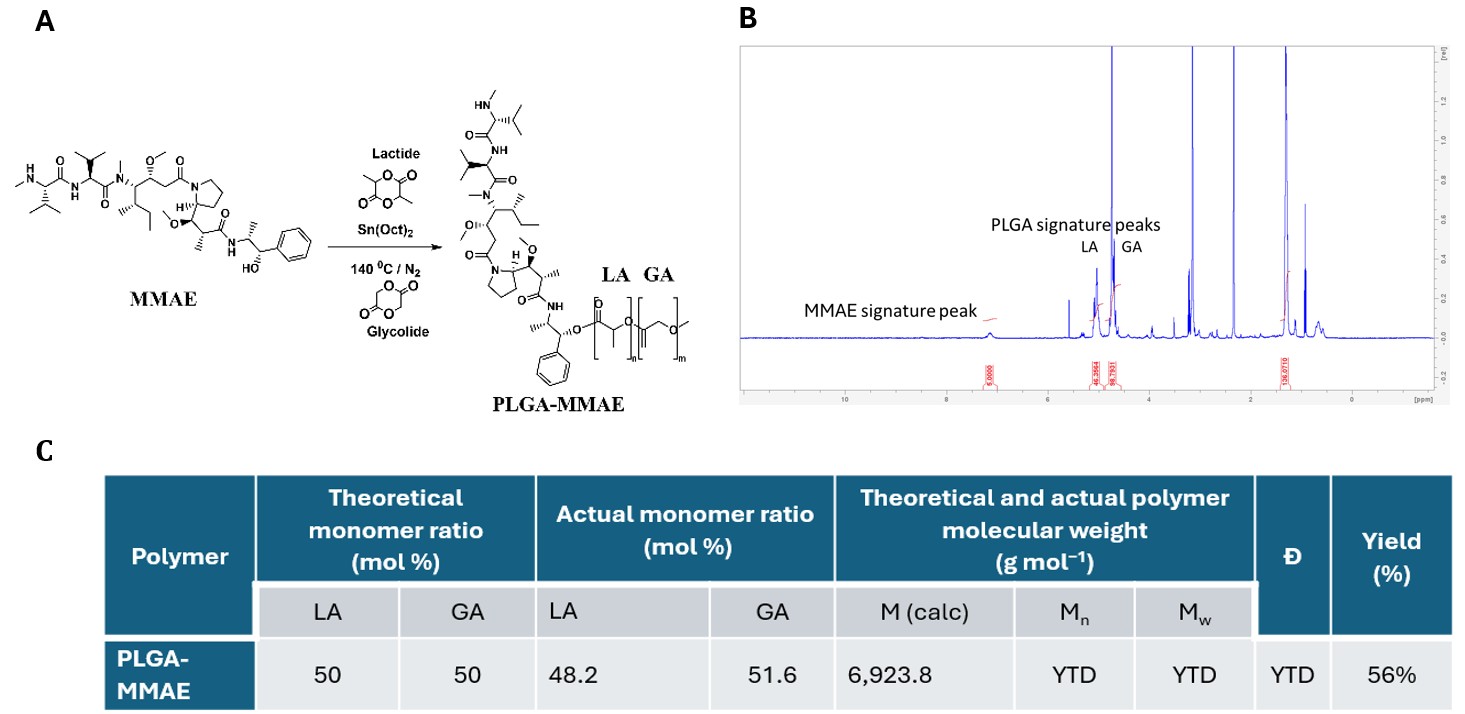 Figure 1: A) Schematic representation of PLGA-MMAE PDC synthesis using ROP reaction. The ROP reaction was conducted at 140 °C under dry nitrogen gas with tin(II) 2-ethylhexanoate (Sn(Oct)2) as the catalyst. B) 1H NMR spectrum of purified PLGA-MMAE PDC in DMSO-d6 (prepared by ROP as described earlier; MMAE acts as the initiator of ROP reaction. C) A table summarizing PLGA-MMAE PDC characteristics based on 1H-NMR analysis and theoretical values (M(calc) is the PDC molecular weight calculated using the 1H-NMR result).
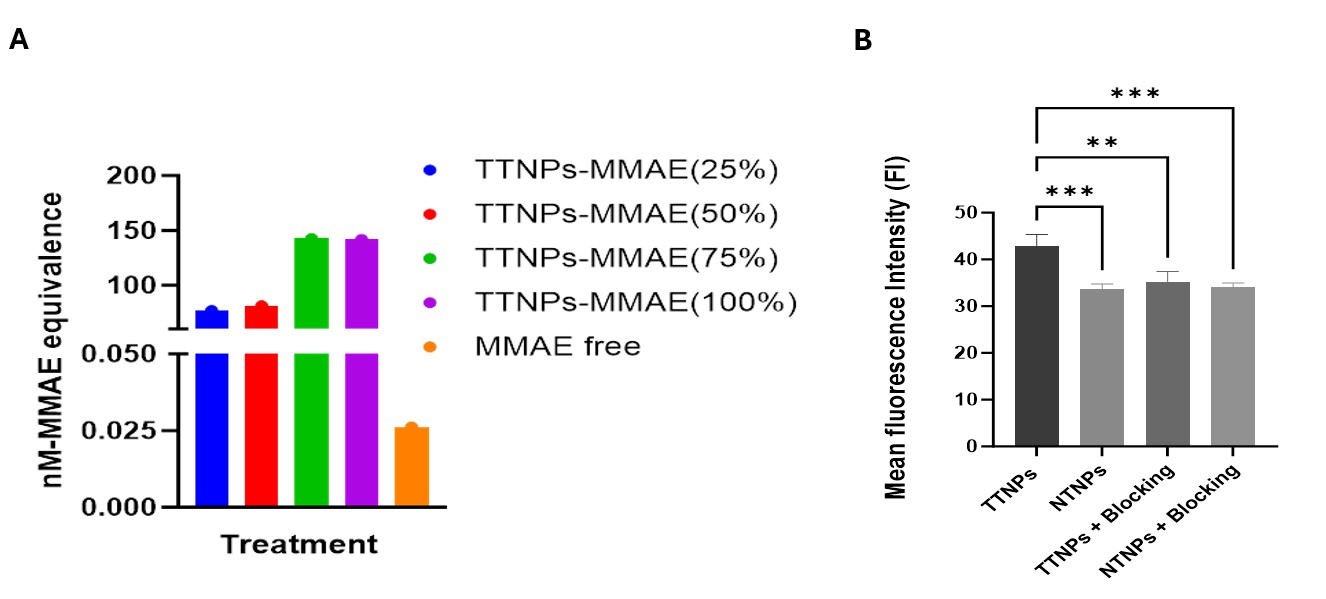 Figure 2: A) IC50 values of TTNPs made of different fractions of PDC, calculated based on the equivalent amount of MMAE content. B) NP uptake assay: Flow cytometric relative mean fluorescence intensities of HT29 cells treated with fluorescently labelled TTNPs, NTNPs, TTNPs + EGFR blocking and NTNPs + EGFR blocking, at a concentration 100 µg/mL for 1 hour. n=4, one-way ANOVA, ** p-value < 0.01, *** p-value < 0.001
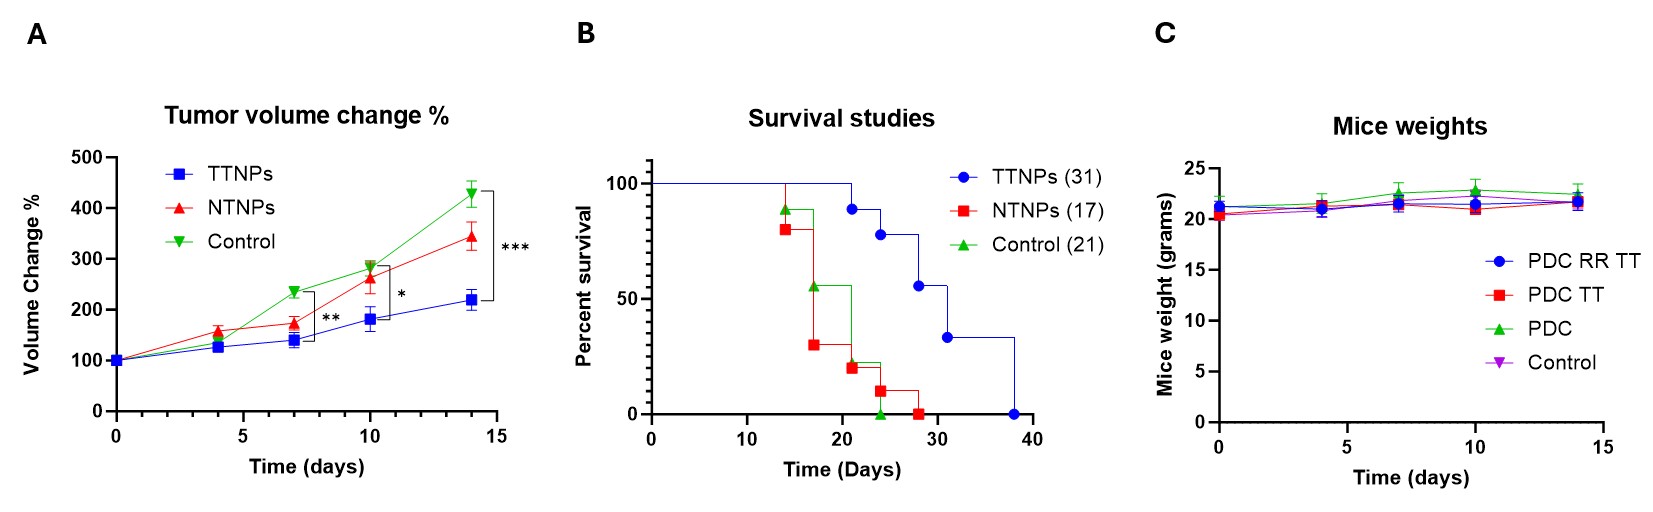 Figure 3: A) Tumor growth profiles for HT29 tumor-bearing nude mice, I.V. injected with TTNPs or NTNPs equivalent to ~0.13 mg of MMAE per mouse (6.5 mg-MMAE/kg) or untreated control (n = 9 per group). Two doses on Day 0 and Day 7. Statistical analysis was performed using a one-way ANOVA. Data are presented as mean ± SEM. * p-value < 0.05, ** p-value < 0.01, *** p-value <0.0001. B) Kaplan–Meier survival curves that compare variously treated mice with the control group. Values of median survival are shown in brackets. C) Mice weight change over time during treatments. Mice were weighed every 3-4 days. Data are presented as mean ± SEM. **** p-value < 0.0001. E) Kaplan–Meier survival curves that compare variously treated mice with the control group. Values of median survival are shown in brackets. F) Mice weight change over time during treatments. Mice were weighed every 3-4 days. Data are presented as mean ± SEM.