
Manufacturing and Analytical Characterization - Chemical

Bhupendra Raj Giri, MS
Graduate Student
University of Texas at Austin
Austin, Texas, United States
Bhupendra Raj Giri, MS
Graduate Student
University of Texas at Austin
Austin, Texas, United States
 photo")
Abdelrahman M. Helmy, PhD (he/him/his)
Assistant Professor
Badr University in Assiut
Asyut, Asyut, Egypt
Mohammed Maniruzzaman, Ph.D.
Professor
University of Mississippi
Oxford, Mississippi, United States
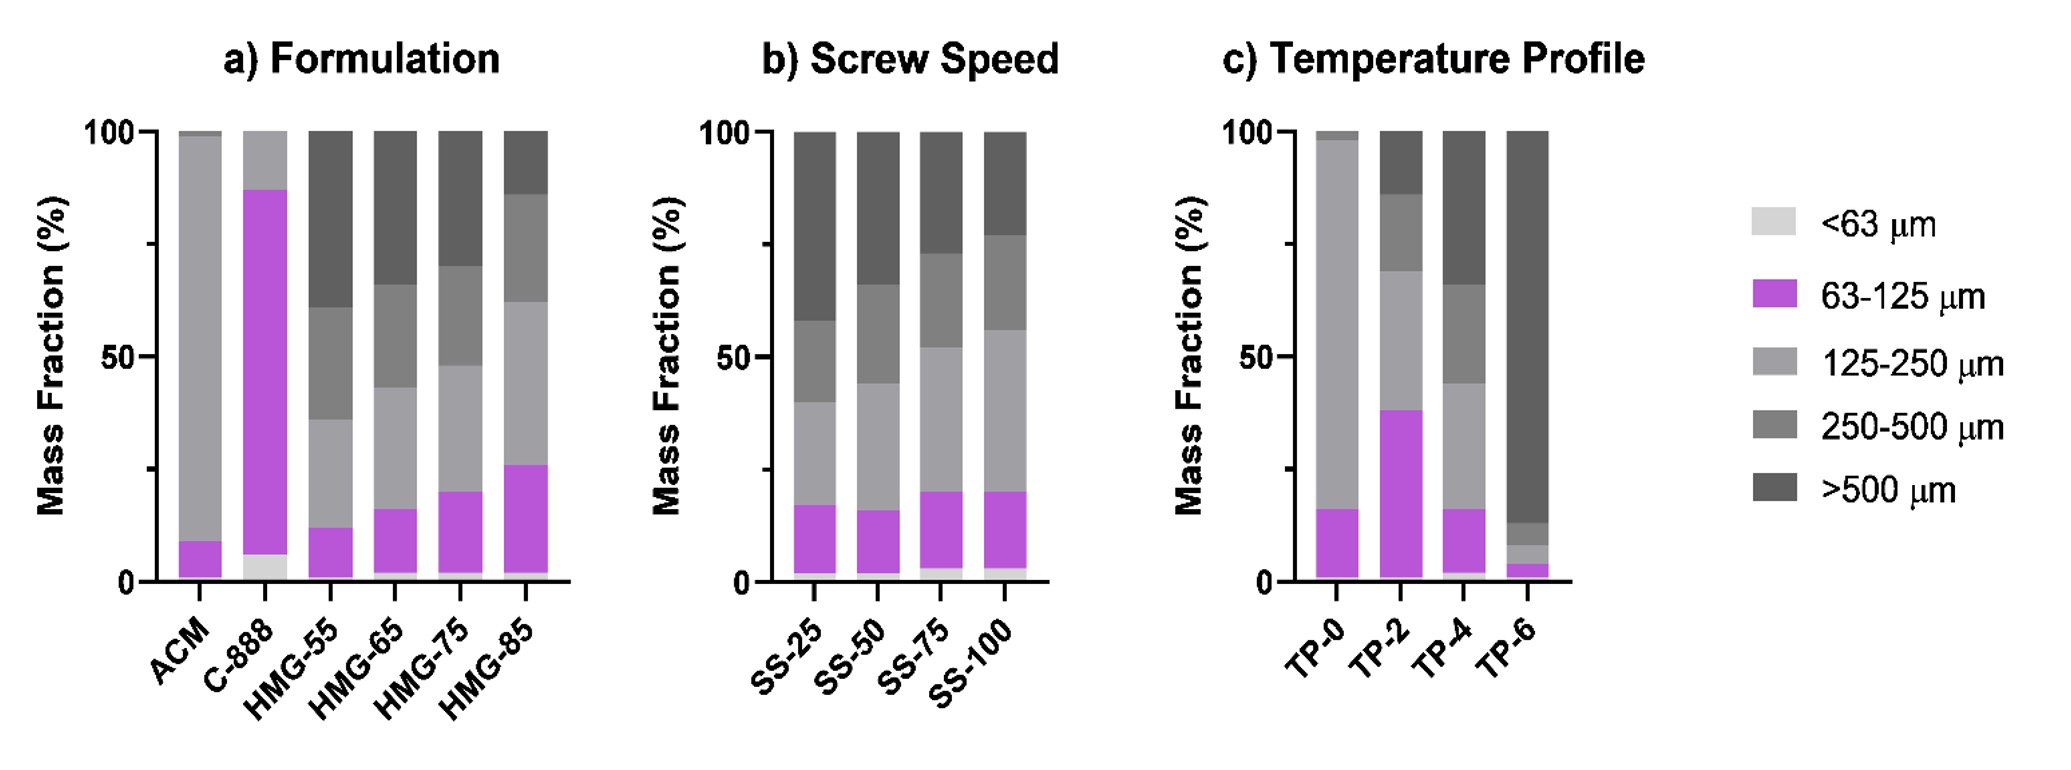 Figure 1. Mass fraction (%w/w) of hot-melt granules as a function of a) formulation ratios, b) screw speed, and c) extruder temperature profiles.
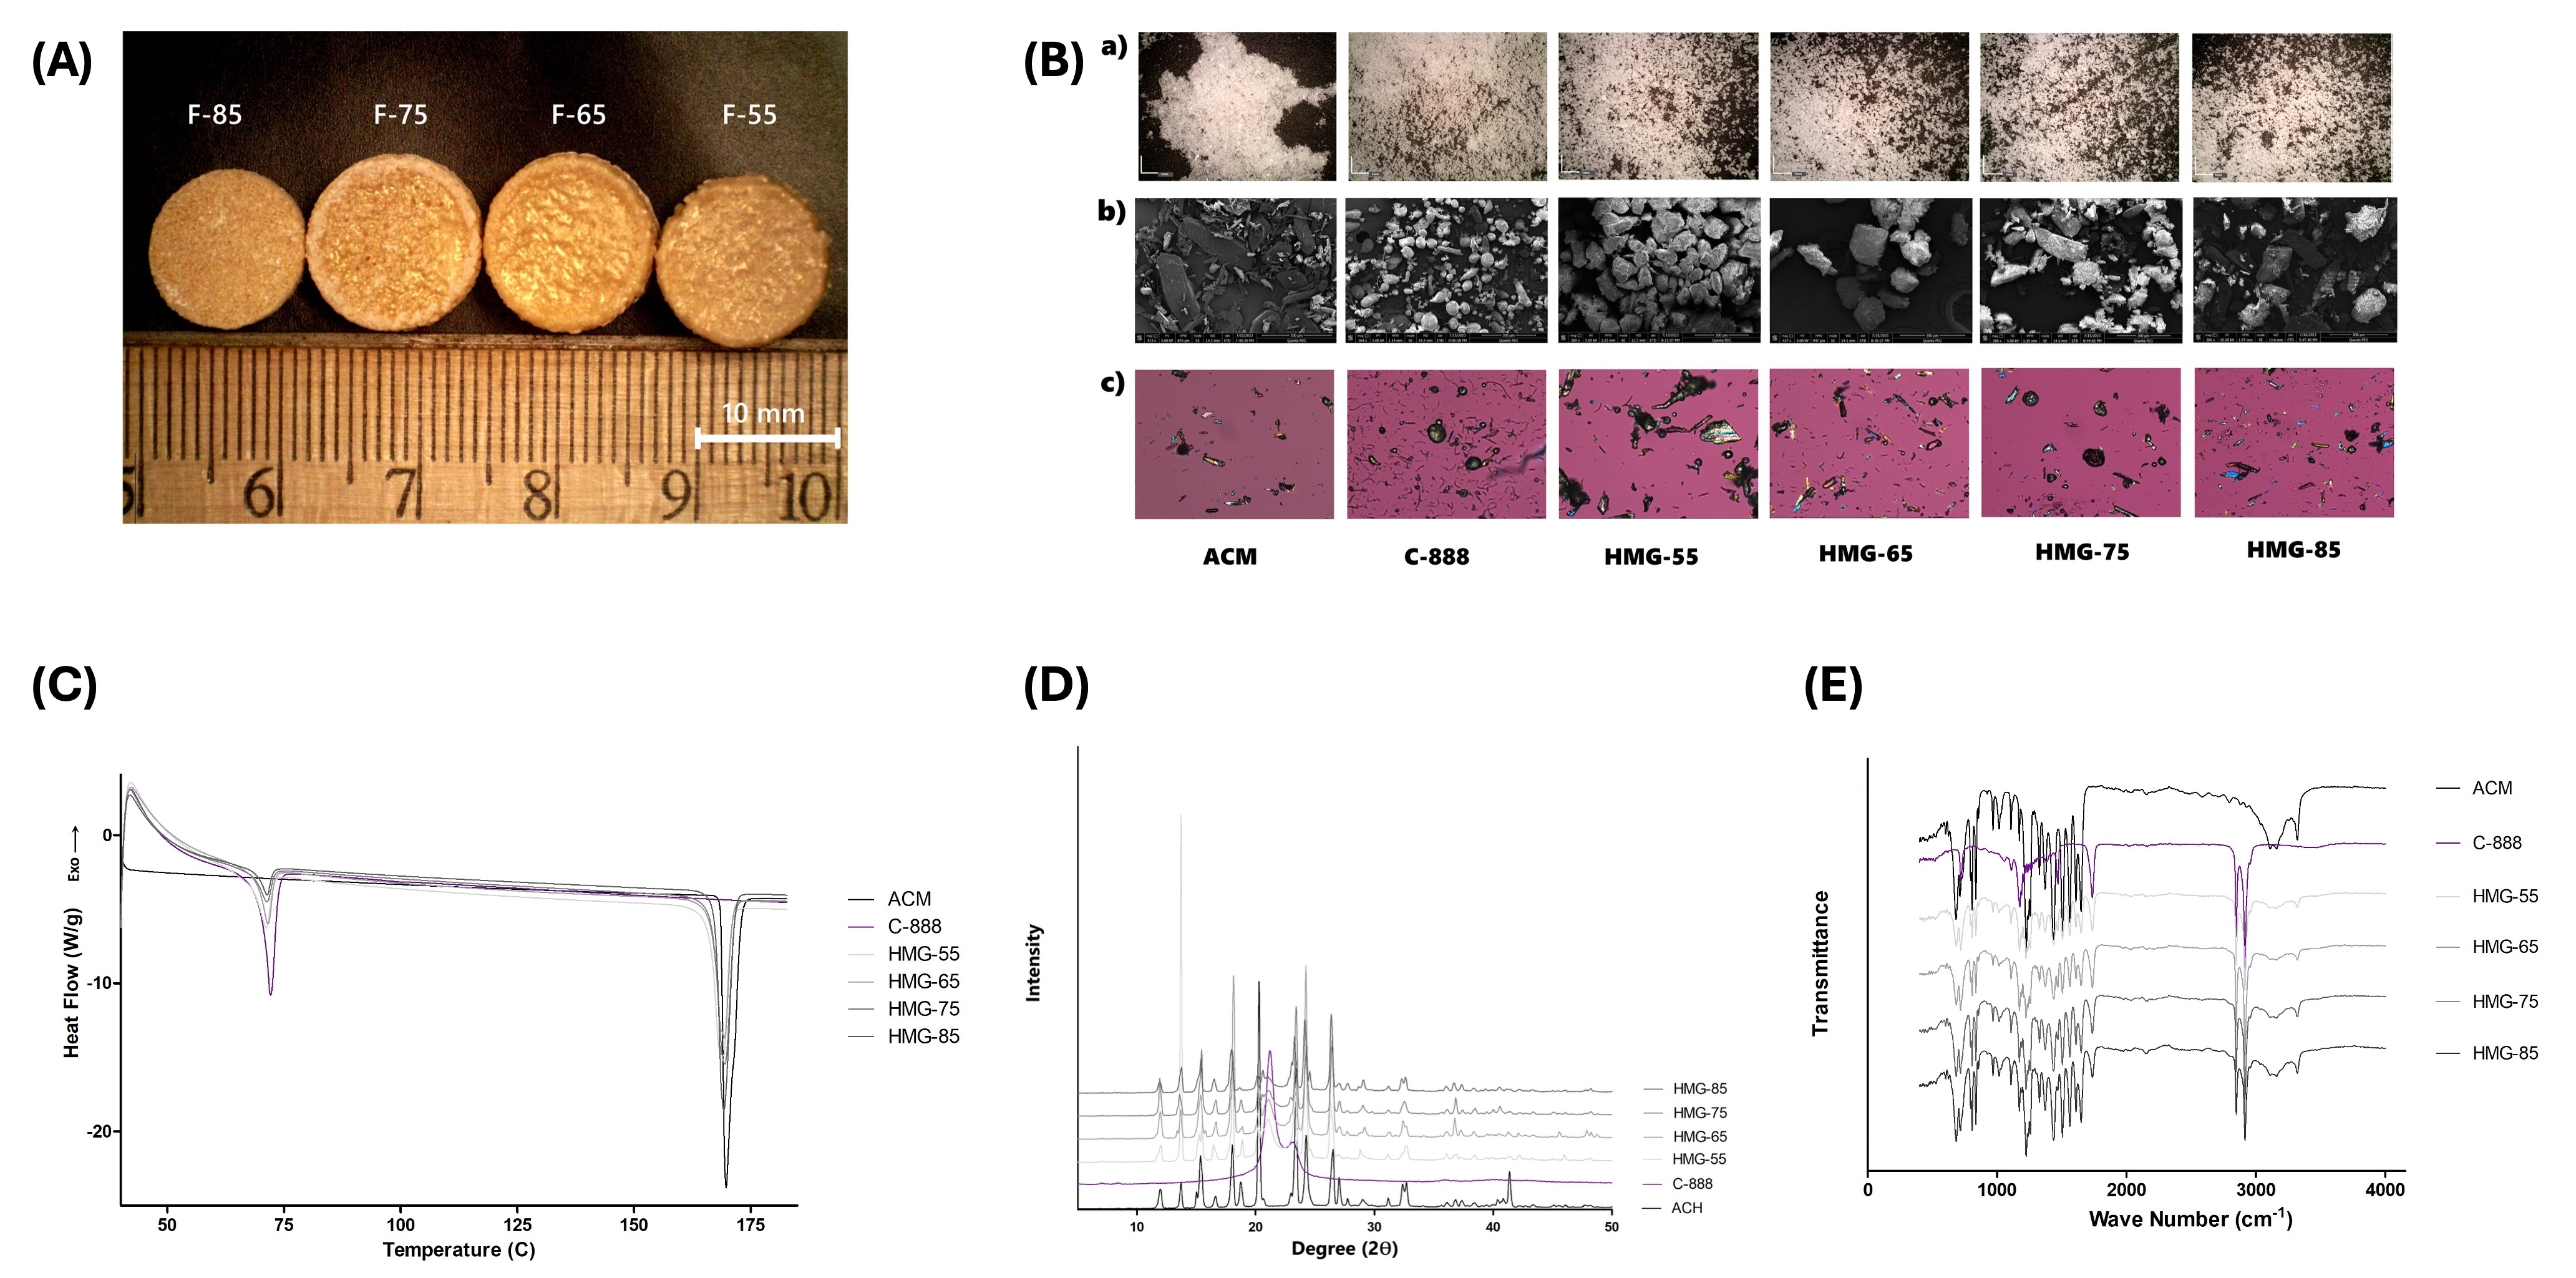 Figure 2: A) Digital light microscopic images of the SLM 3D-printed tablets with varying drug load; B) Digital light microscopic, scanning electron microscopy (SEM), and polarized light microscopy (PLM) images; C) differential scanning calorimetry; D) powder X-ray diffraction; and E) FT-IR spectra of the drug (ACM), lipid (C-888), and HMG granules from four different formulations denoted as HMG-55, HMG-65, HMG-75, and HMG-85 based on the 55-85% (w/w) drug load.
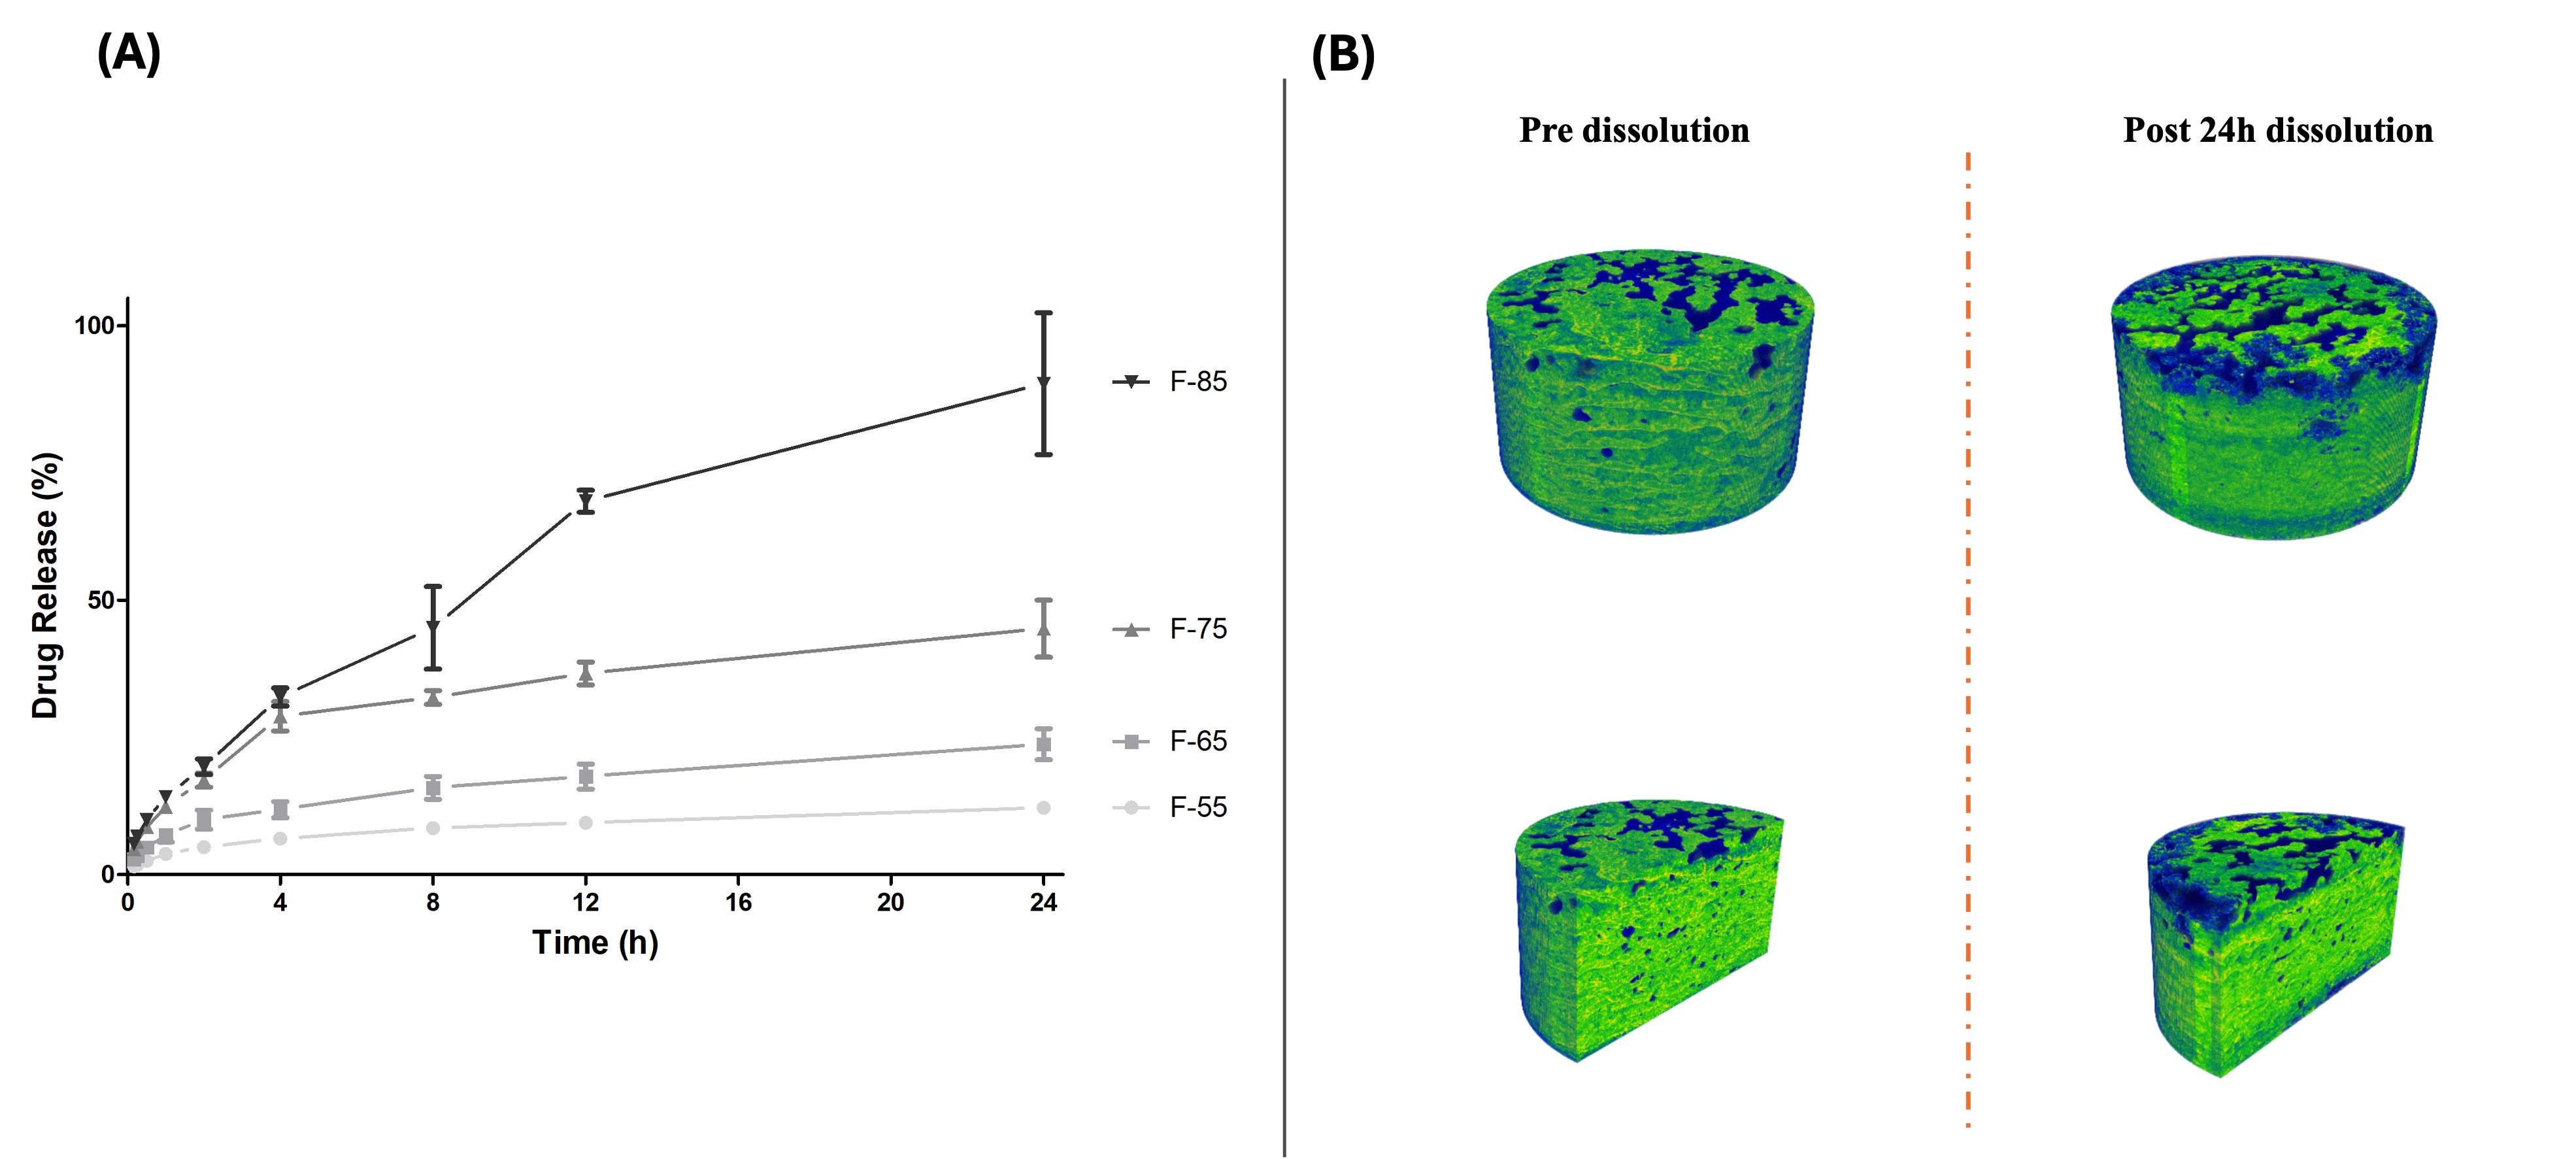 Figure 3: A) In vitro drug release profile of the SLM 3D-printed tablets from various formulations with varying drug loads (55–85% w/w); B) X-ray micro-CT images showing the top surface and inner pores of the SLM 3D-printed tablet (F-65 formulation) pre- and post-24 hours of dissolution study.