
Formulation and Delivery - Chemical
Chun-Hao Fan, MS
Master
National Taiwan University
Taipei City, Taipei, Taiwan (Republic of China)

Wei-Ren Ke, PhD
Assistant Professor
National Taiwan University
Taipei City, Taipei, Taiwan (Republic of China)
Mou-Wei Chang, Ph.D. Student
Ph.D student
National Yang Ming Chiao Tung University
Taipei City, Taipei, Taiwan (Republic of China)
Wen-Jui Wu
Doctor
MacKay Memorial Hospital
Taipei City, Taipei, Taiwan (Republic of China)
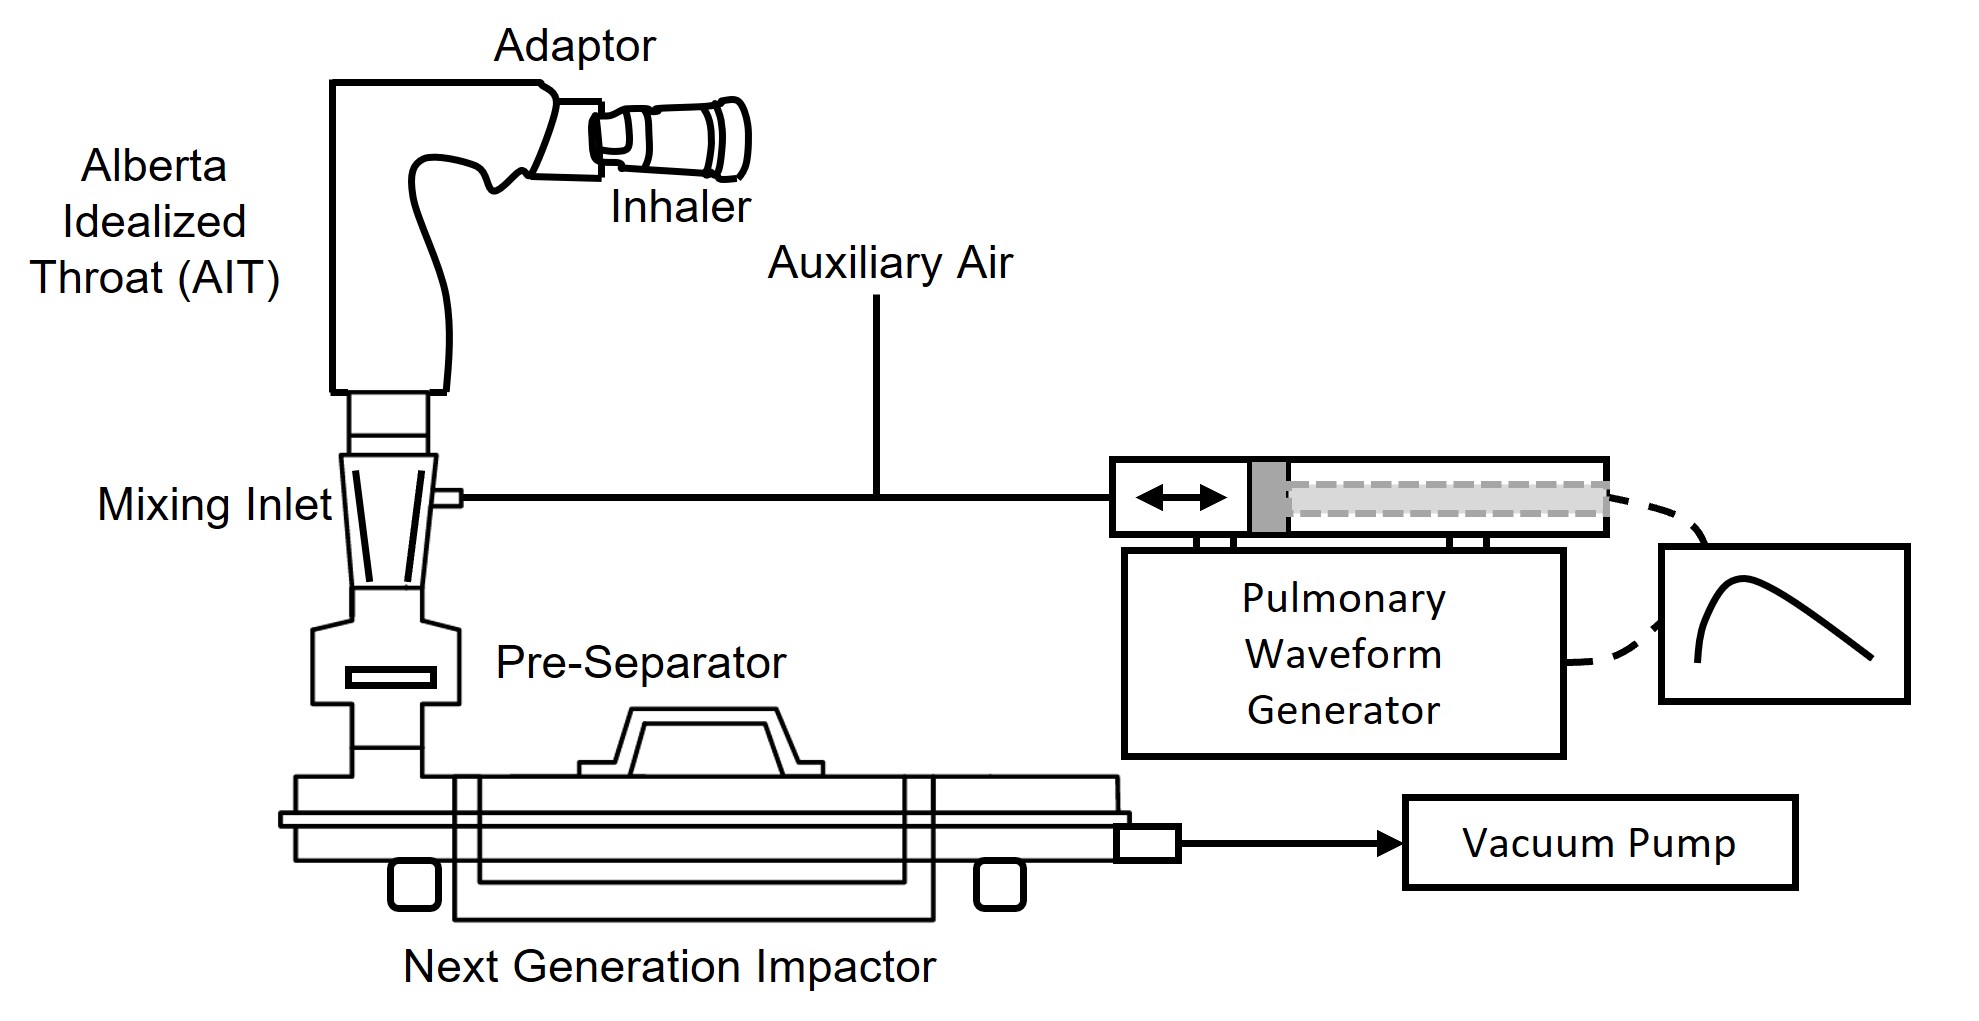 Figure 1. Inhalation profile simulation system setup
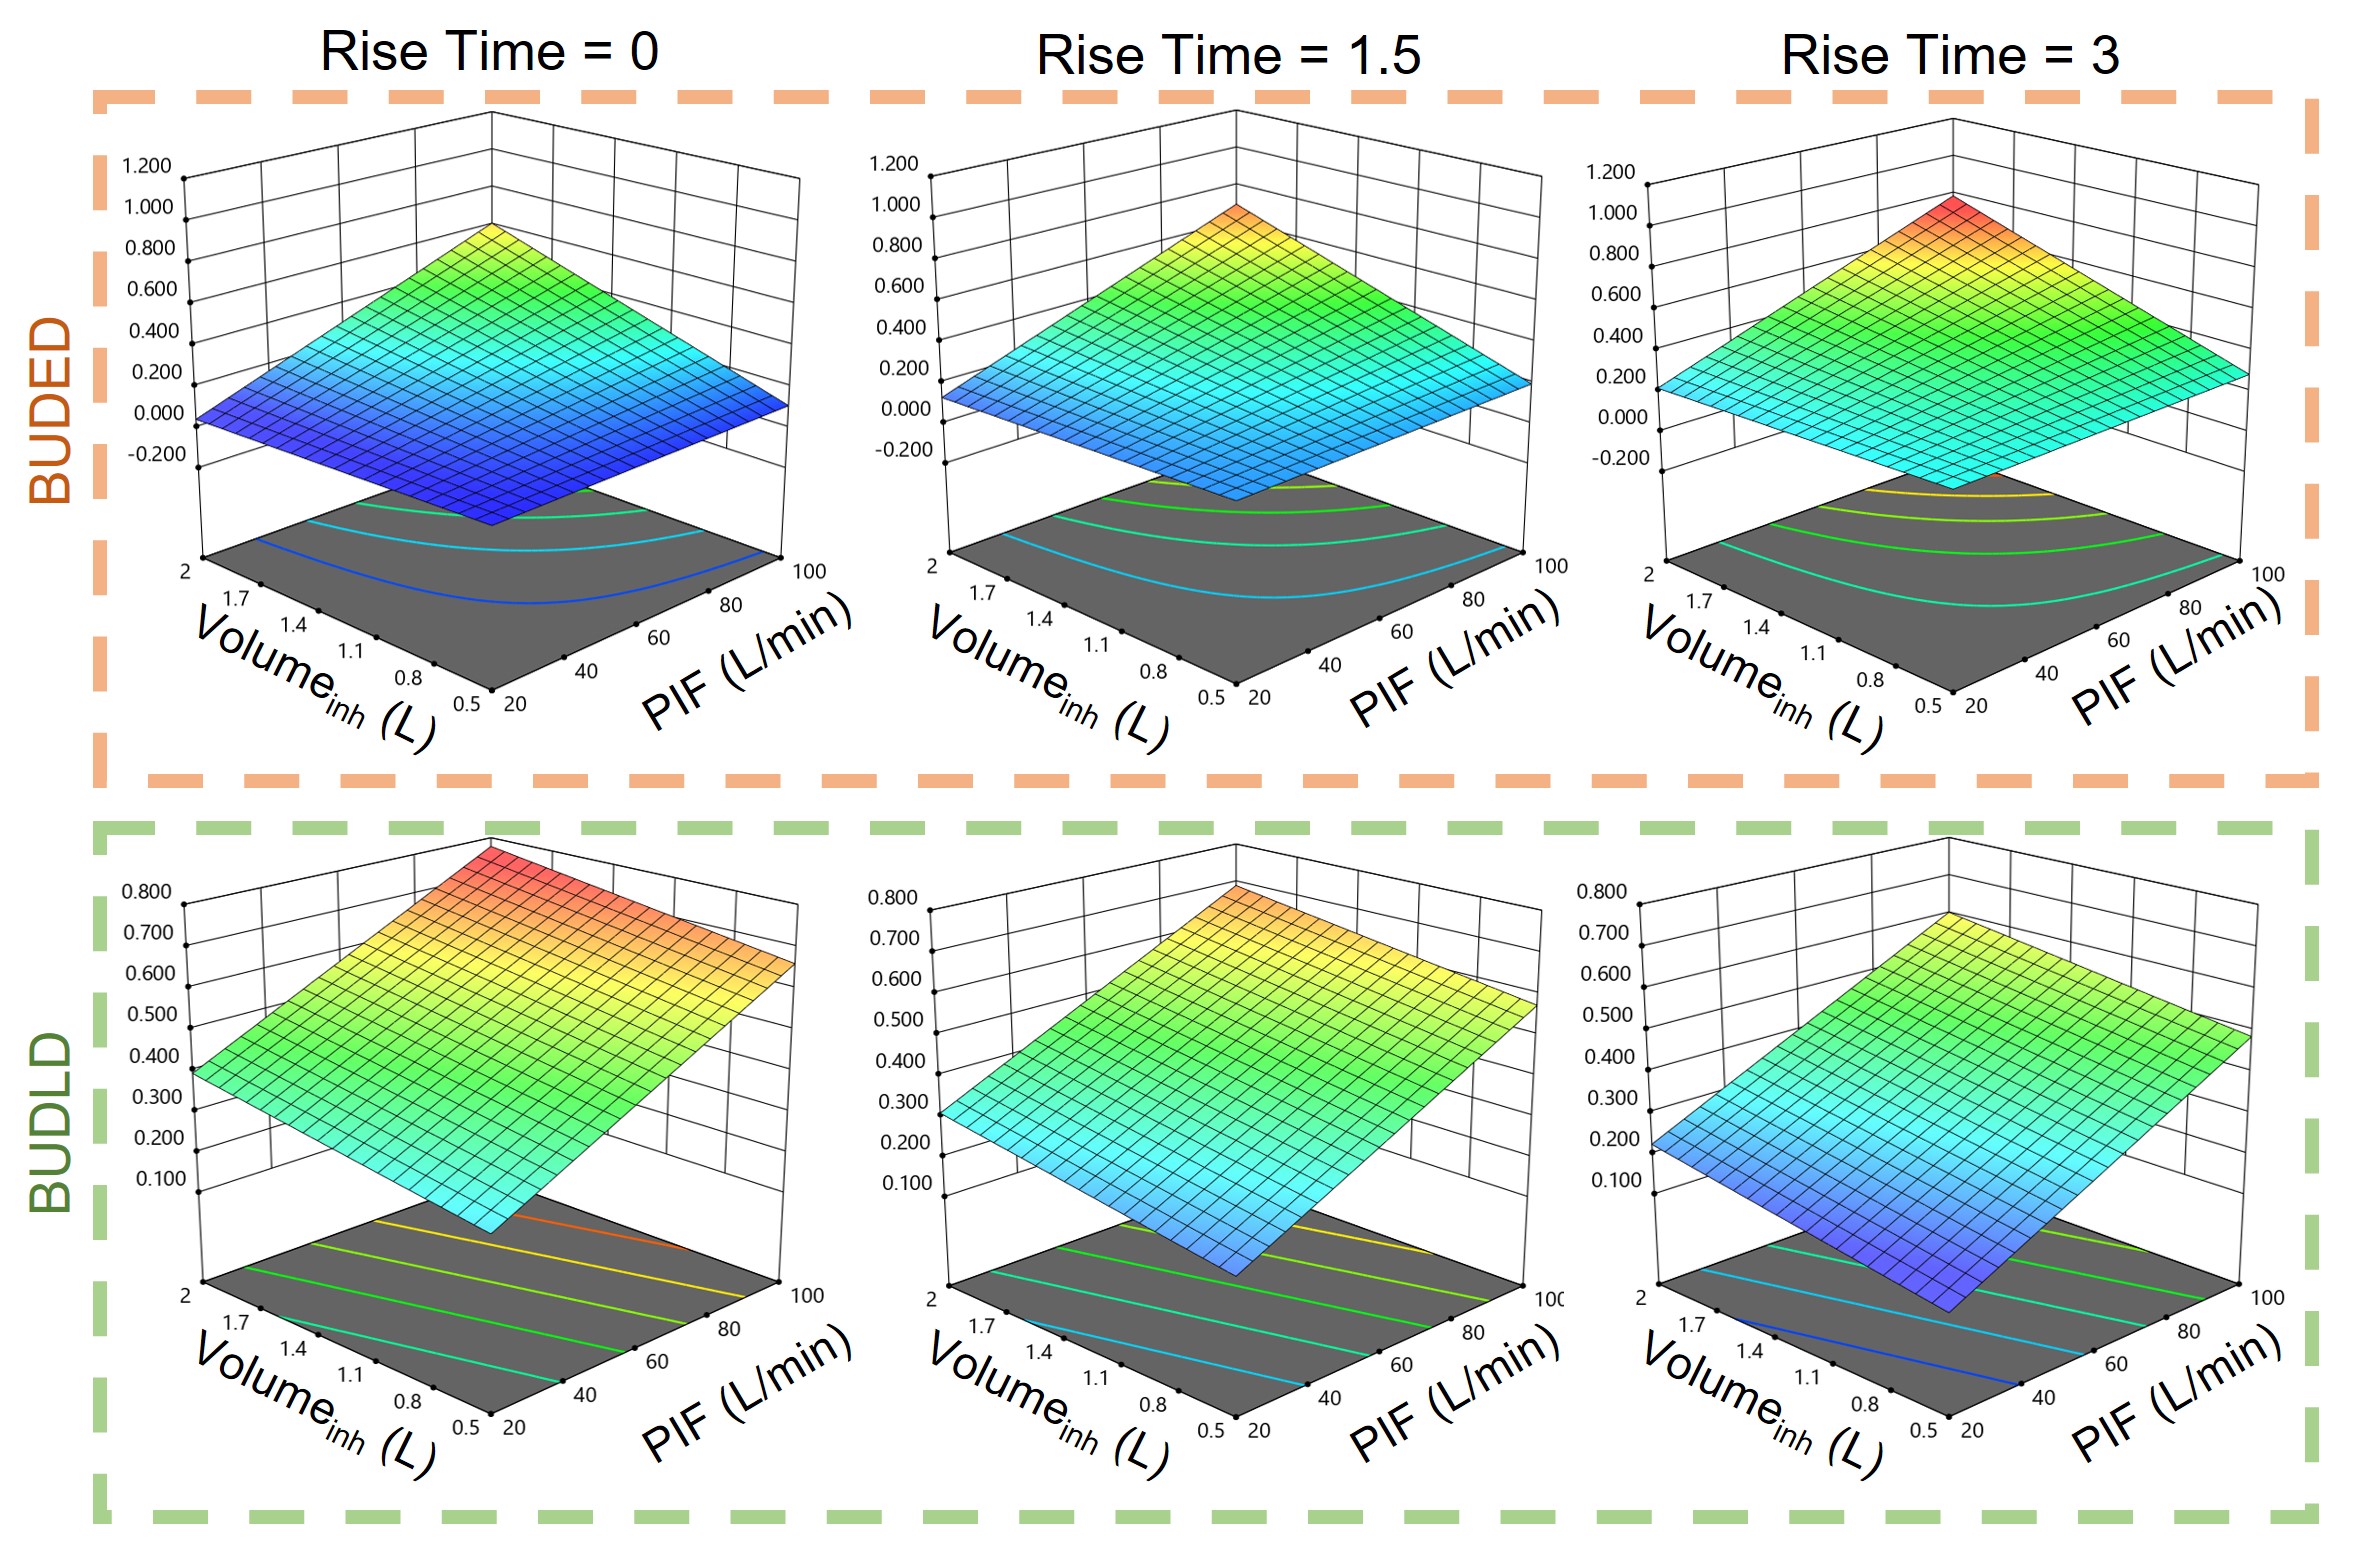 Figure 2. Three-dimensional surface plots illustrating the effects of PIF (20–100 L/min), inhaled volume (0.5–2 L), and rise time to PIF (0, 1.5, and 3 s) on BUDED and BUDLD from the Symbicort Turbuhaler®. Volumeinh: inhaled volume.
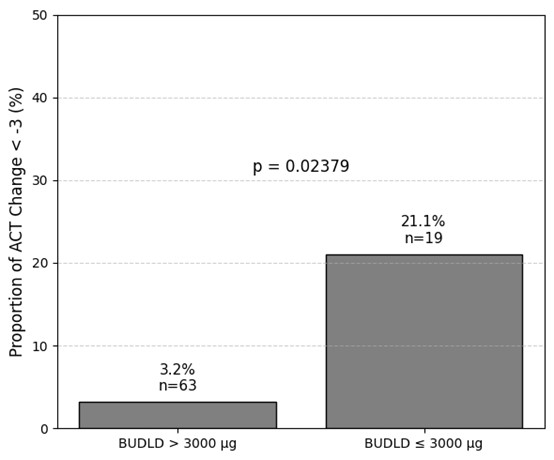 Figure 3. Proportion of ACT deterioration stratified by 4-week BUDLD dose. Bar chart showing the percentage of patients with ACT Change < −3, grouped by a 4-week BUDLD threshold of 3,000 μg. The proportion of ACT deterioration was significantly higher in the low-dose group (≤3,000 μg) compared to the high-dose group (>3,000 μg) (p = .0238, Fisher’s exact test). Sample sizes are indicated for each group.