
Preclinical, Clinical, and Translational Sciences
Pornpoj Phruttiwanichakun, Pharm.D., M.Sc. (they/them/theirs)
Graduate student
University of Iowa
Iowa City, Iowa, United States
Pornpoj Phruttiwanichakun, Pharm.D., M.Sc. (they/them/theirs)
Graduate student
University of Iowa
Iowa City, Iowa, United States
Rui He, MS
Graduate Student
University of Iowa
Iowa City, Iowa, United States
Douglas C. Fredericks (they/them/theirs)
Animal Research Surgicenter Director
University of Iowa
Coralville, Iowa, United States
Emily B. Petersen
Animal Research Surgicenter Head Veterinarian
University of Iowa
Coralville, Iowa, United States
Sainiket Panyam
Scholar/Trainee
University of Iowa
Iowa City, Iowa, United States

Aliasger K. Salem, PhD
Bighley Chair and Professor of Pharmaceutical Sciences
University of Iowa
Iowa City, Iowa, United States
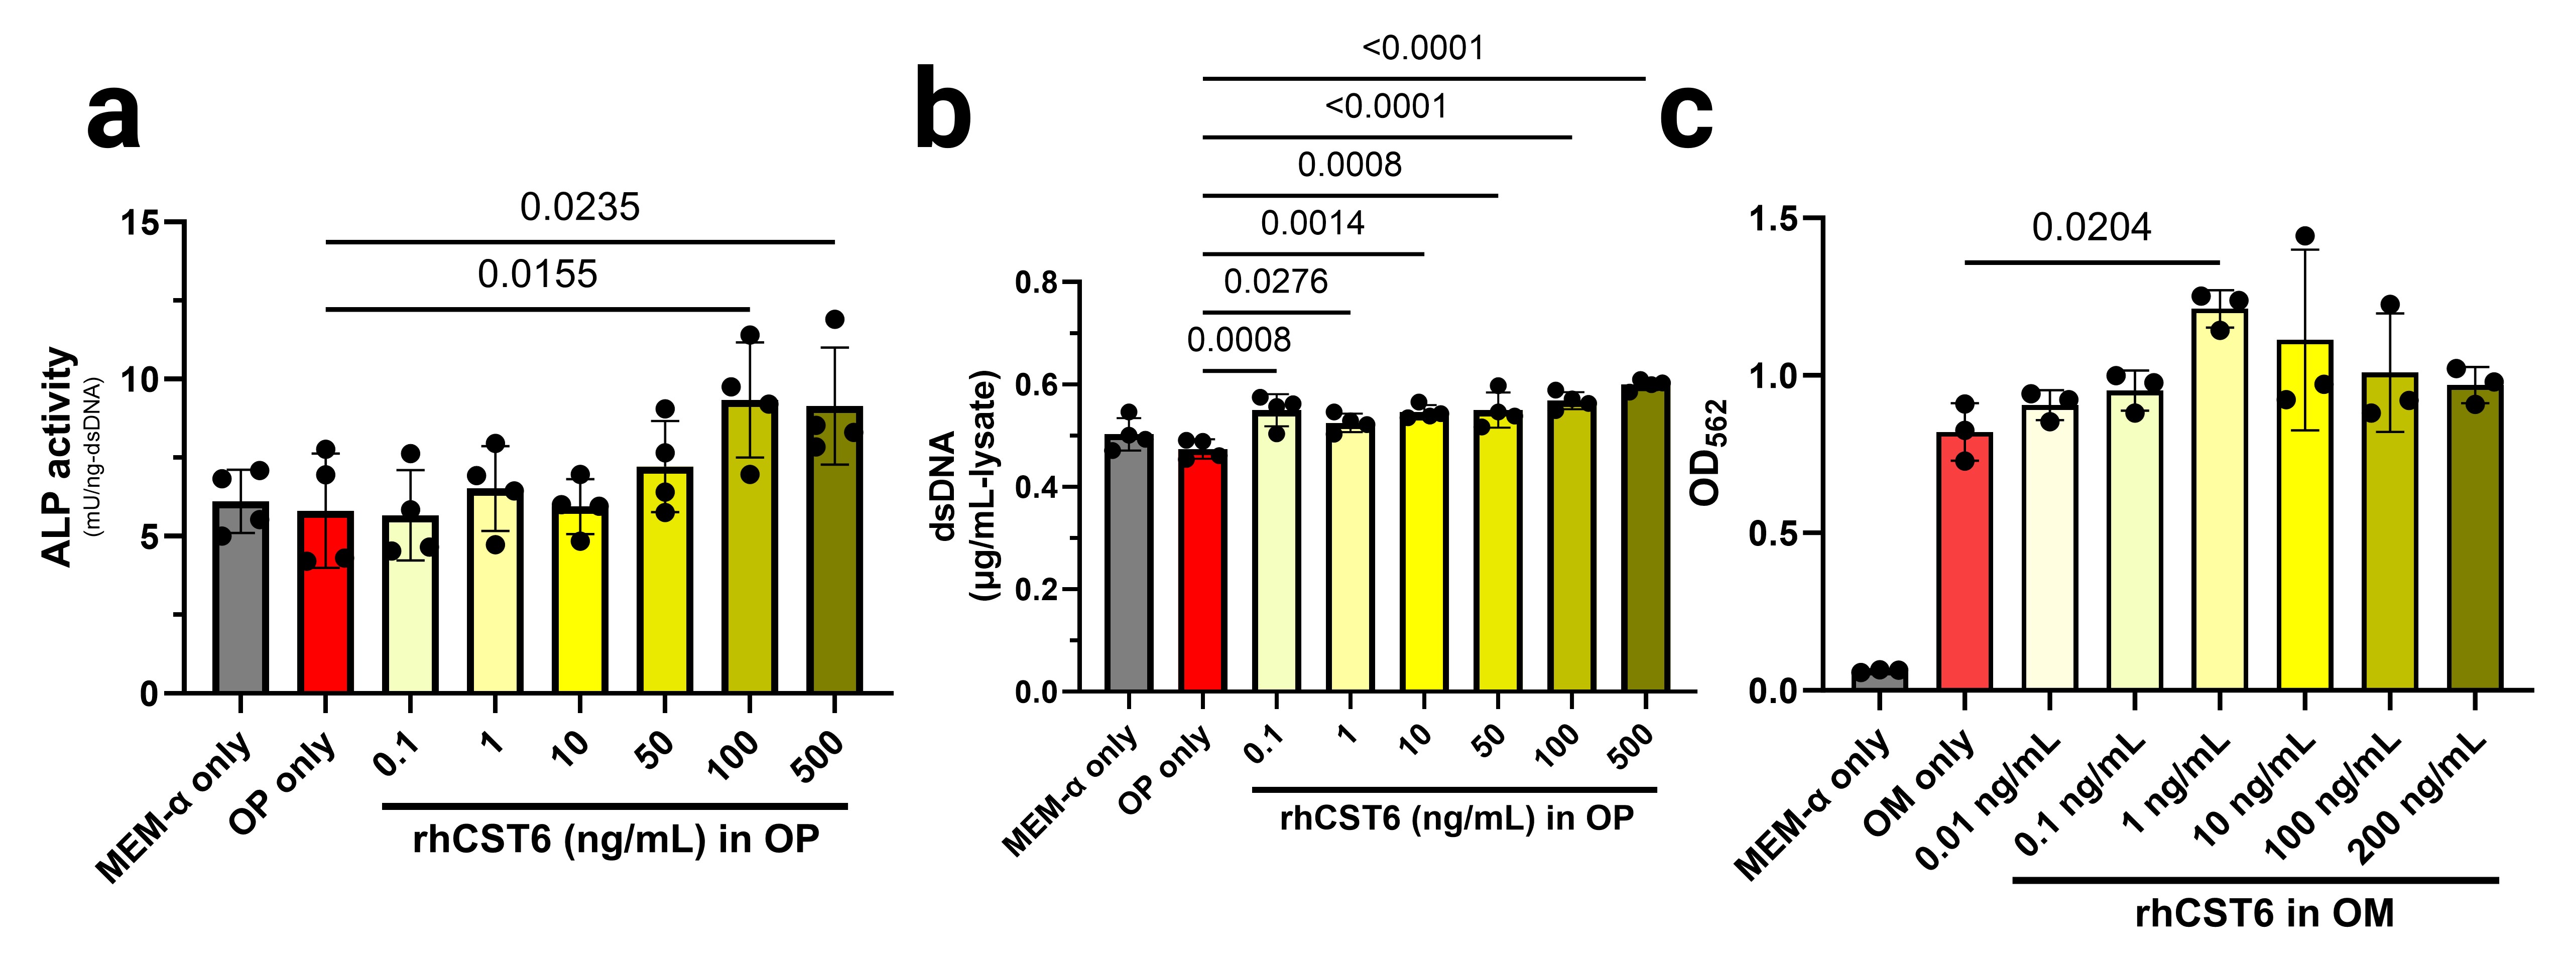 Figure 1: In vitro osteogenic and mineralization effects of rhCST6 protein in hBMSCs and MC3T3-E1 (subclone 4) cells in presence of osteo-permissive or osteogenic media. (a) alkaline phosphatase activity assay of hBMSC cell lysates with normalization to the total dsDNA content in the lysate (after 7 days of culture). (b) total dsDNA contents in the hBMSC cell lysates (after 7 days of culture). (c) semi-quantification of alizarin red S staining of the MC3T3-E1 cell monolayers with/without rhCST6 protein (after 7 days of culture). The alizarin red S-stained deposits were extracted using acetic acid and subsequently neutralized using ammonium hydroxide before absorbance measurements. MEM-α = complete MEM-α supplemented with 10% fetal bovine serum, 100 U/mL PenStrep, and 4 mM GlutaMAX™; OP = osteo-permissive medium; OM = osteogenic medium. OP and OM were of the same composition, which was the complete MEM-α supplemented with 10 mM β-glycerophosphate and 50 µg/mL magnesium ascorbyl phosphate. Statistical analysis was performed using ordinary one-way ANOVA followed by Dunnett’s tests versus the OP (or the OM) only group at the significance level of 0.05.
 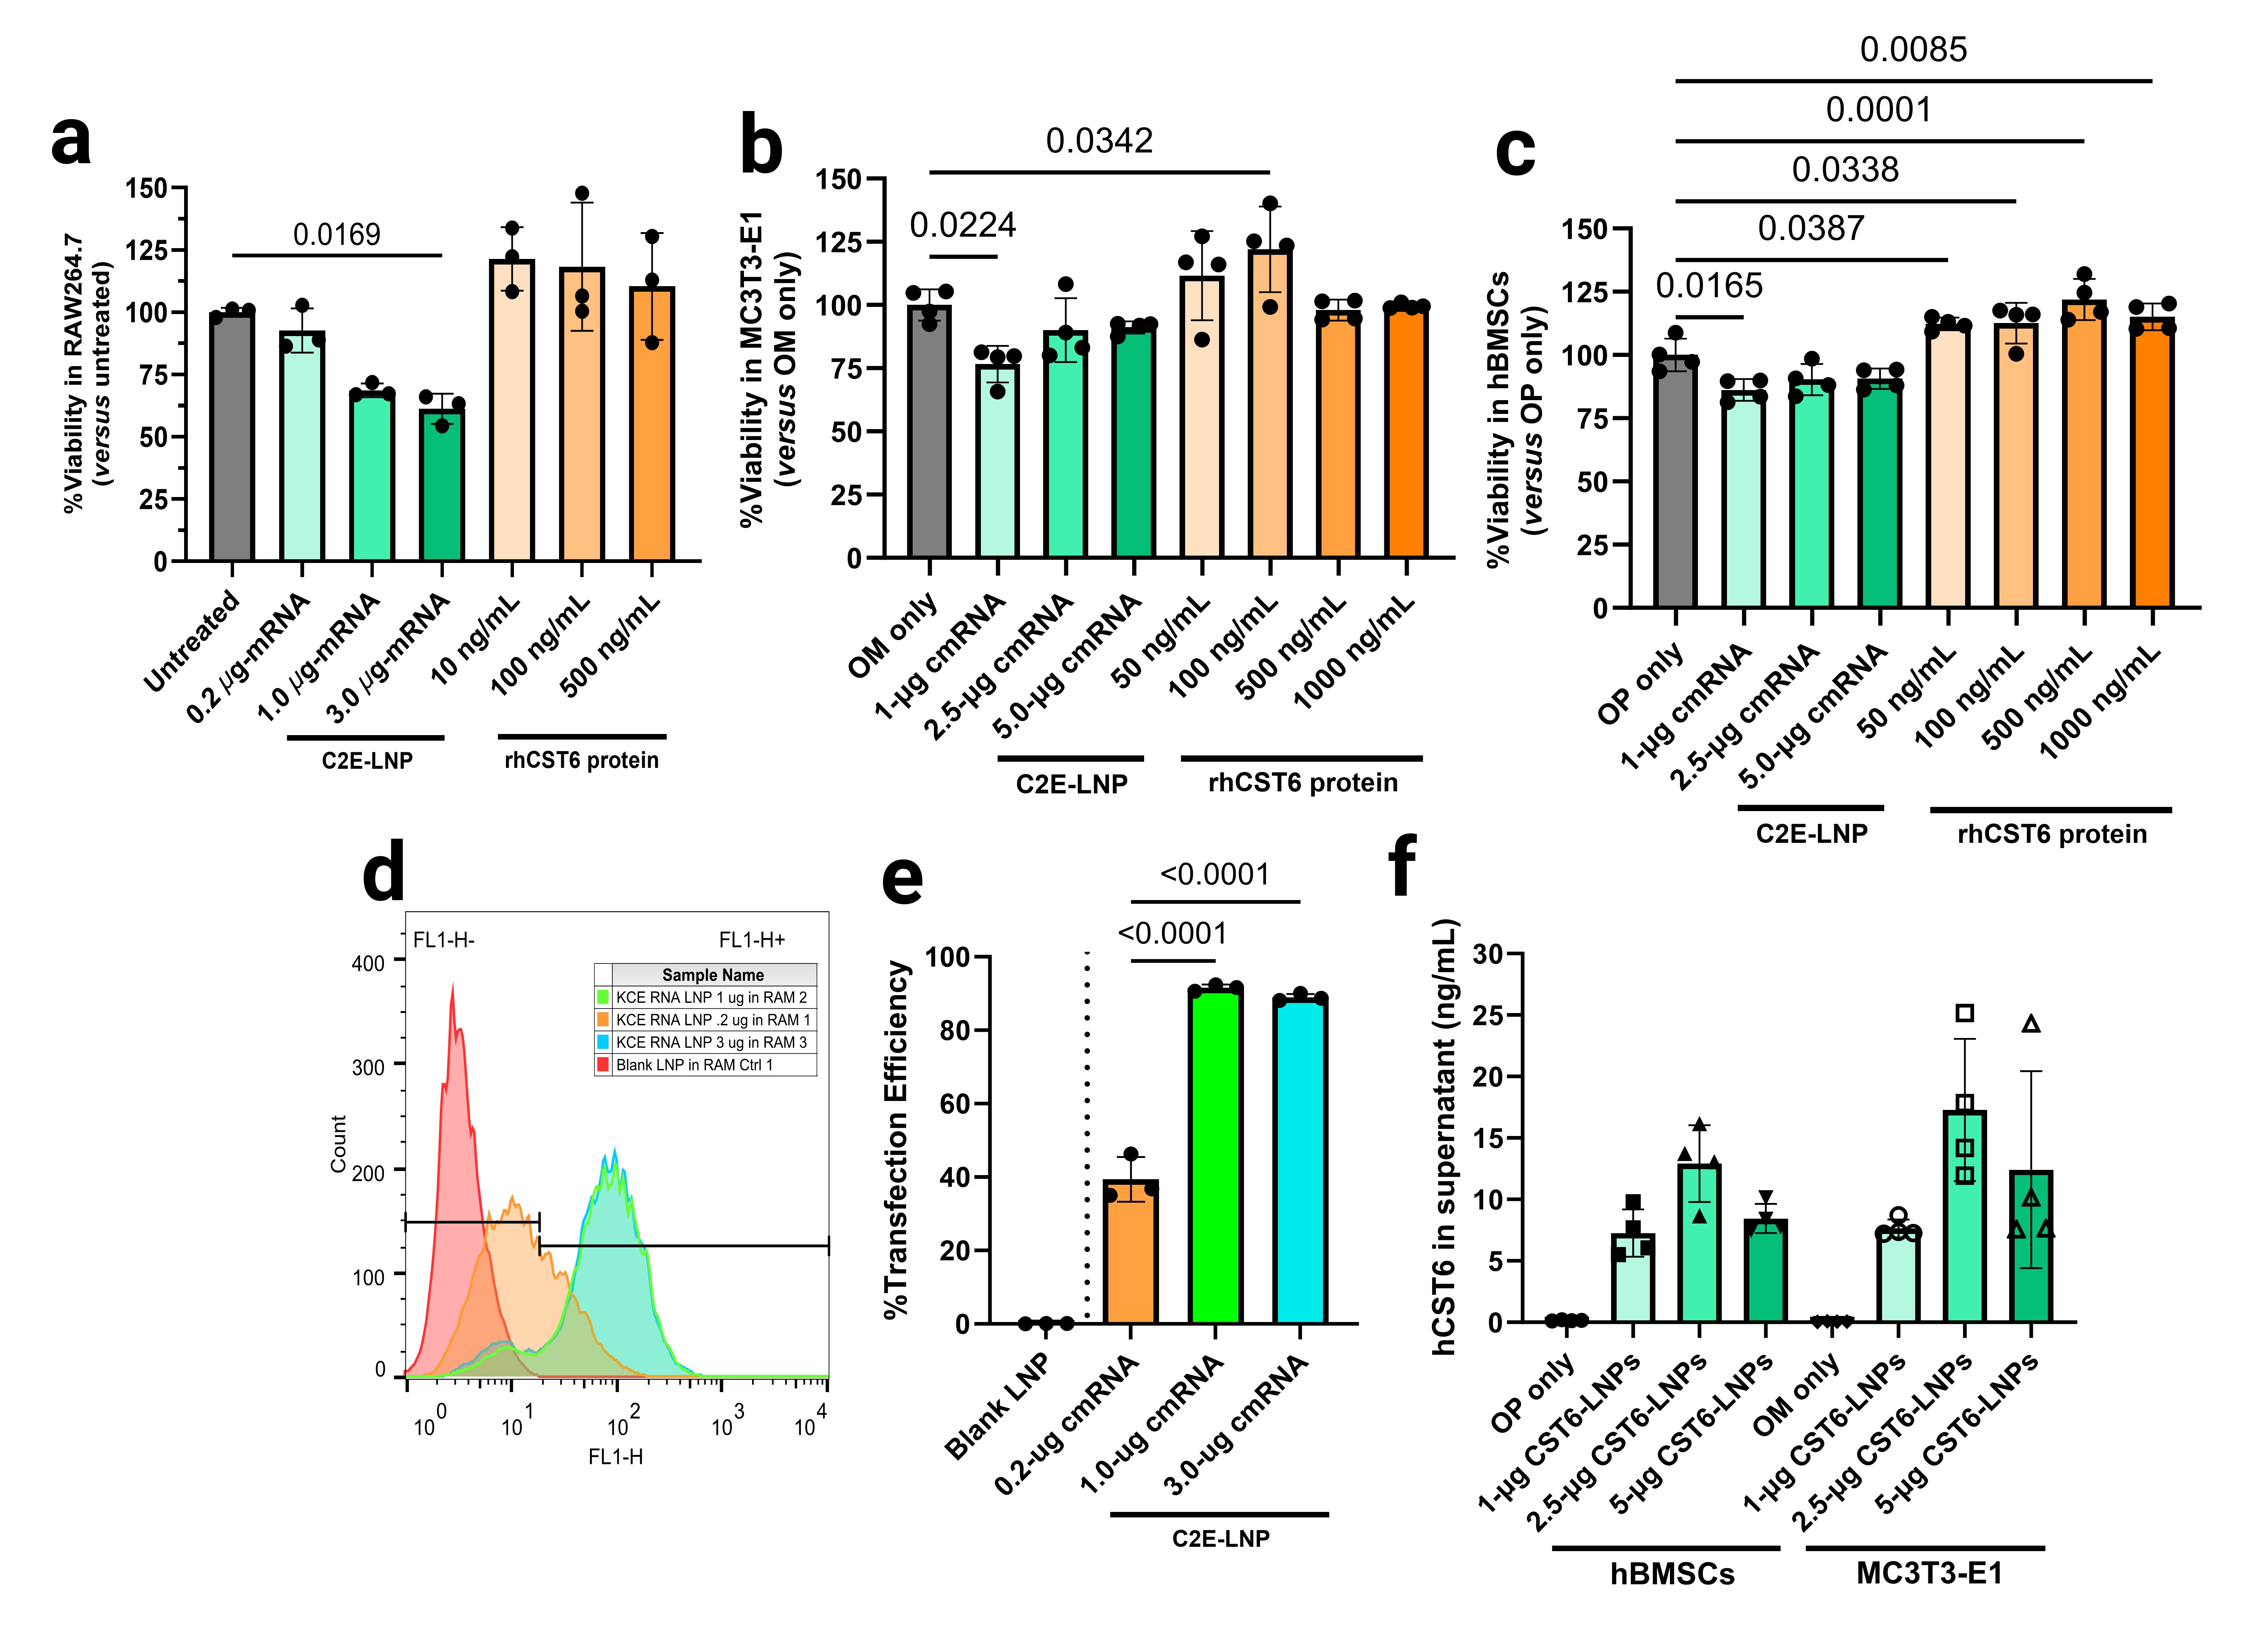 Figure 2: Cell viability, %transfection, and secreted hCST6 levels at 24 hours after hCST6-P2A-eGFP-coding cmRNA delivery (as lipid nanoparticles) in various cell types. MTS assays show minimal cytotoxicity in (a) RAW264.7 cells, (b) MC3T3-E1 subclone 4, and (c) hBMSCs. (d) & (e) Flow cytometry results show dose-dependent increases in transfection efficiencies. (f) ELISA results showing that CST6-LNPs delivery successfully induced expression and secretion of hCST6 protein in hBMSCs and MC3T3-E1 subclone 4 cells. OP = osteo-permissive medium; OM = osteogenic medium. OP and OM were of the same composition, which was MEM-α supplemented with 10% fetal bovine serum, 100 U/mL PenStrep, and 4 mM GlutaMAX™ with 10 mM β-glycerophosphate and 50 µg/mL magnesium ascorbyl phosphate. For (a), (b), and (c), statistical analysis was performed using ordinary one-way ANOVA followed by Dunnett’s tests versus the medium only group (i.e., untreated, OM only, or OP only) at the significance level of 0.05. For (e) and (f), statistical analysis was performed using ordinary one-way ANOVA followed by Tukey’s tests (with exclusion of background control groups, namely Blank LNP, OP only, and OM only) at the significance level of 0.05.
 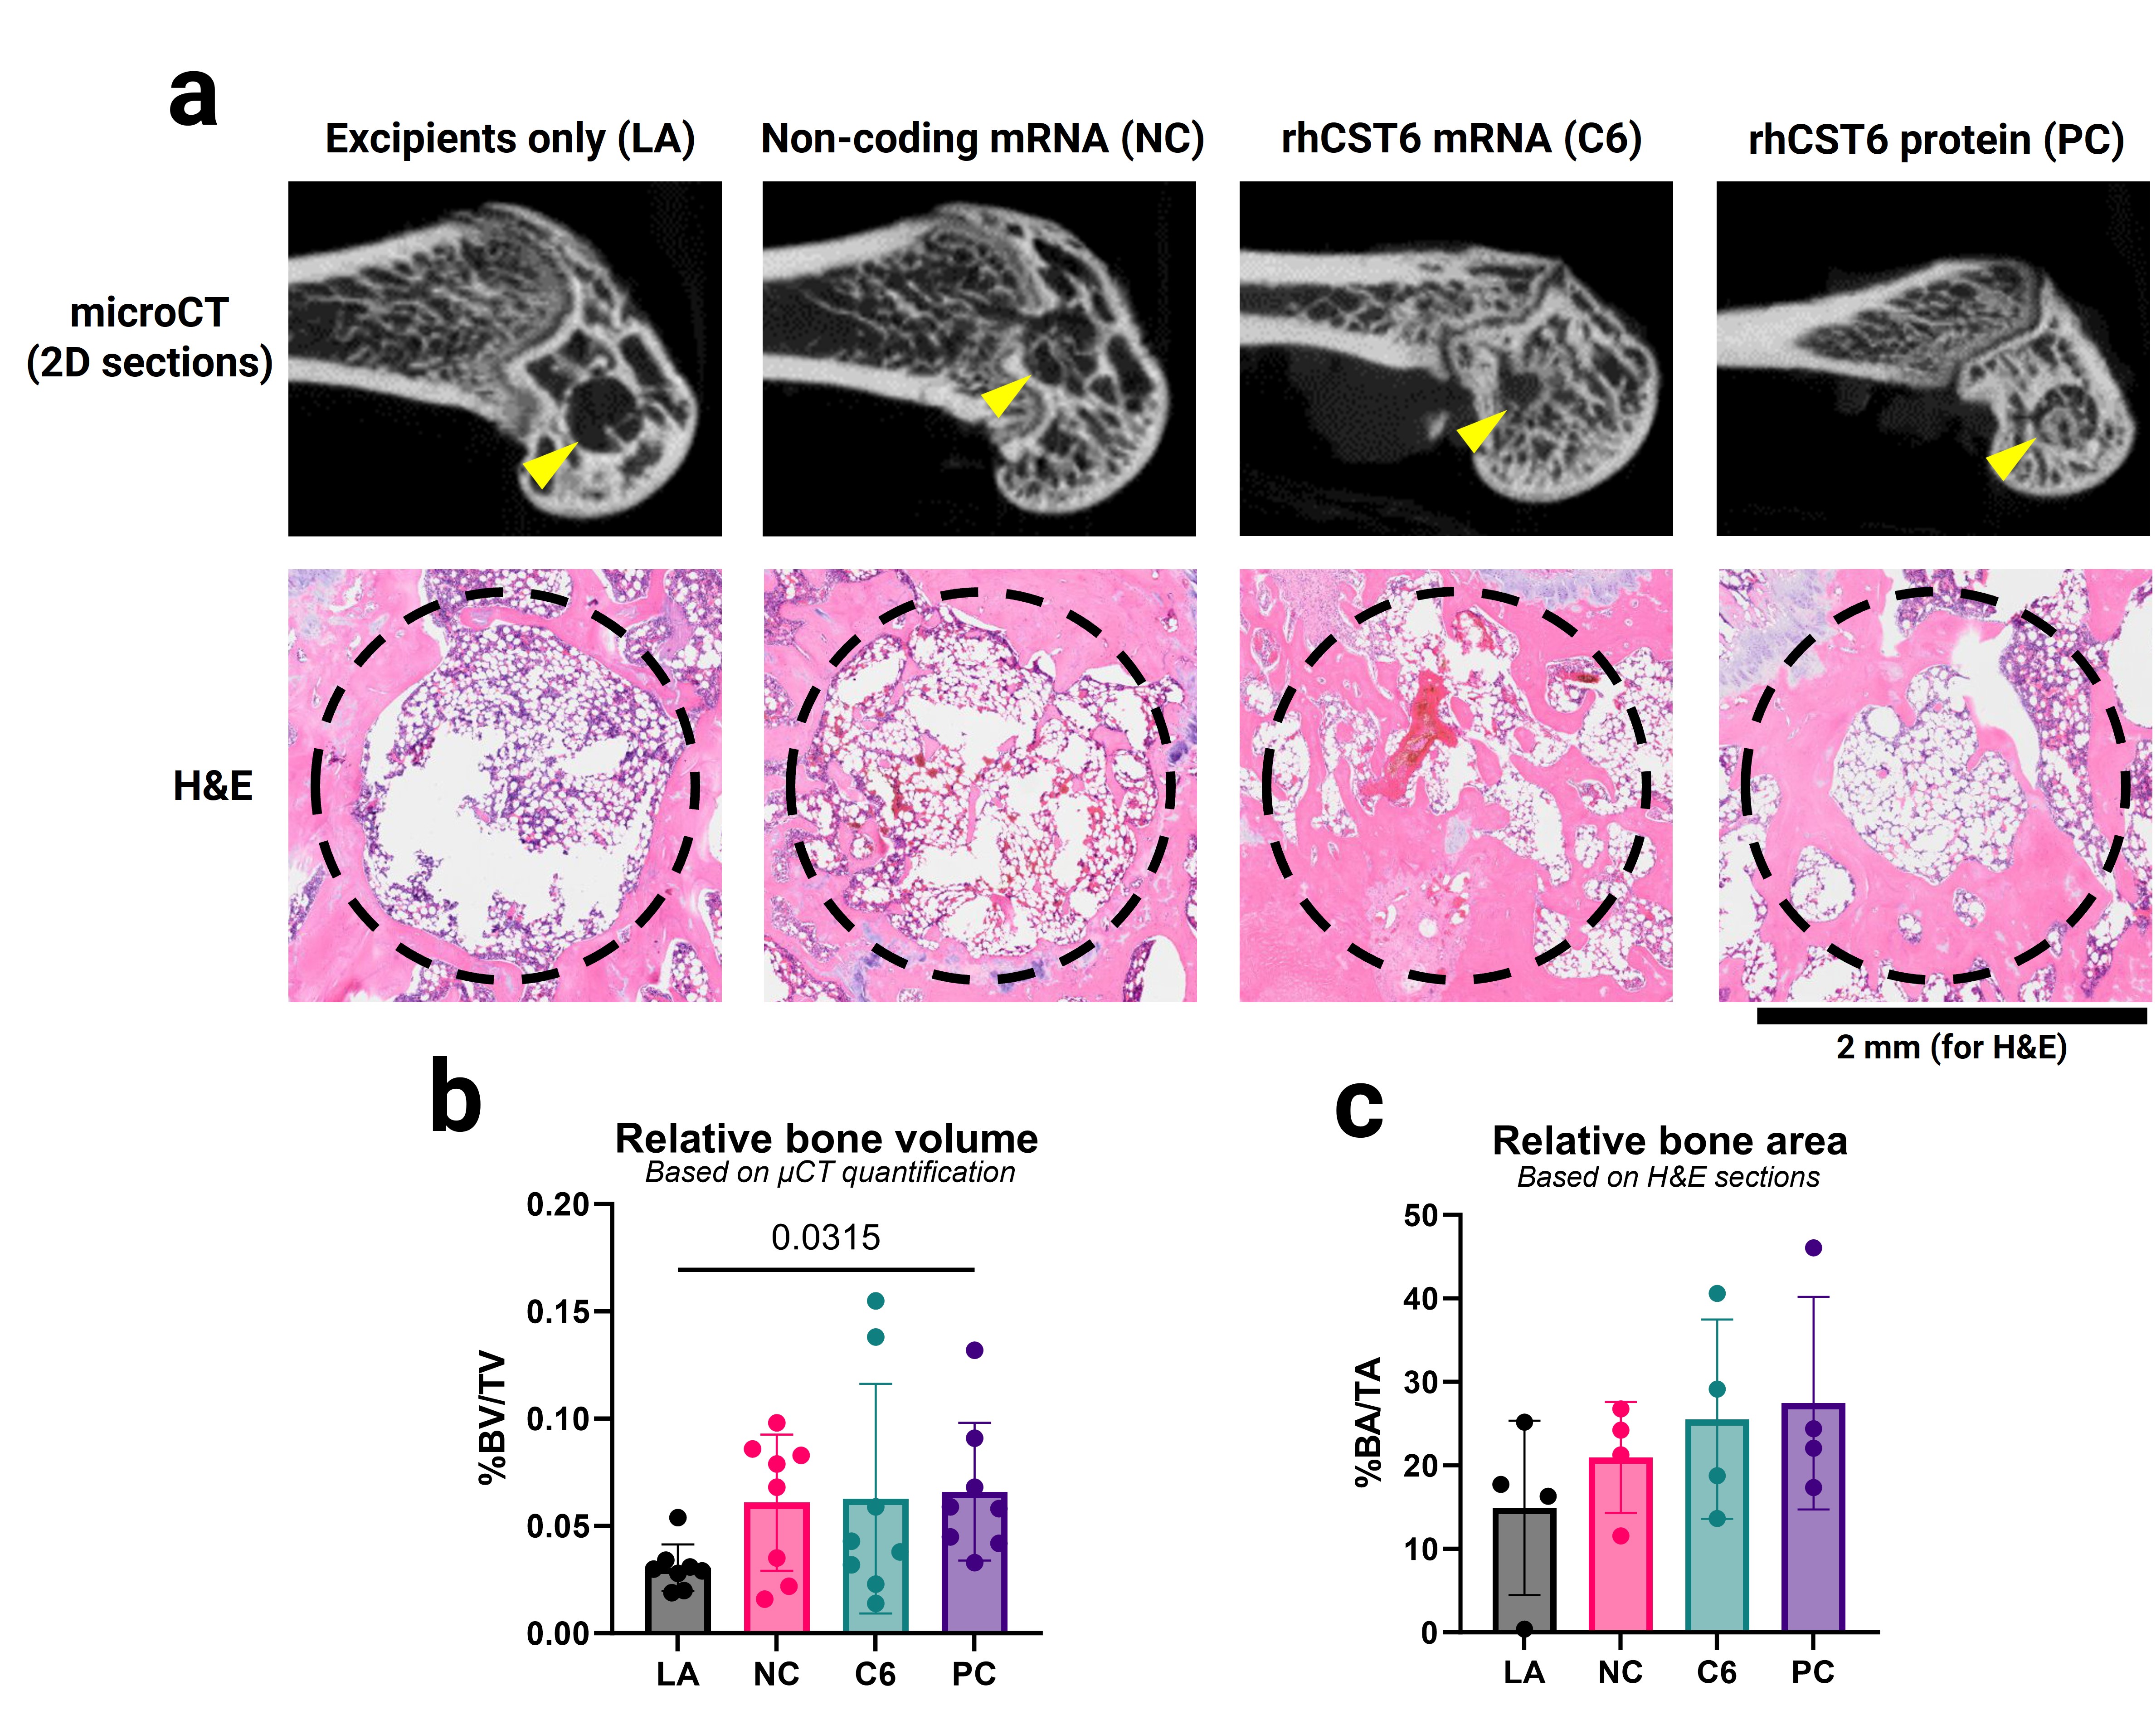 Figure 3: In vivo bone regeneration in the rat femoral metaphysis drill defect model. (a) representative 2D radiographs and H&E sections from each treatment group. Relative bone volumes and relative bone areas were quantified based on (b) micro-CT image reconstruction (n = 8 per treatment group) and based on (c) H&E sections (using ImageJ; n = 4 per treatment group). LA = collagen plug lyophilized with the buffer/cryoprotectant mix only (8%w/v sucrose in 5-mM Tris-HCl, pH 8); NC = collagen plug lyophilized with LNPs loaded with non-coding cmRNA in the buffer/cryoprotectant mix (CST6 sequence with scrambled Kozak sequence and in-frame stop codons); C6 = collagen plug lyophilized with LNPs loaded with CST6-coding cmRNA in the buffer/cryoprotectant mix; and PC = rhCST6 protein lyophilized in PBS, pH 7.4 (similar to the lyophilized product as supplied by the manufacturer of rhCST6 protein). NC and C6 were given as a 25 µg-RNA dose per defect; PC was given as a 15 µg-protein per defect; LA was loaded with the same volume of the buffer/cryoprotectant mix as NC and C6 prior to lyophilization. Collagen plug dimensions prior to lyophilization were 2.0 mm in diameter and 5.0 mm in length. The drill defect dimensions prior to implantation were 2.0 mm in diameter and 4.0 mm in depth. Statistical analysis was performed using ordinary one-way ANOVA followed by Dunnett’s tests versus the LA group at the significance level of 0.05.