Manufacturing and Analytical Characterization - Chemical
(M1430-02-09) Advancing Lean Chemometrics: Minimizing Material Expenditure with Iterative Optimization Technology
- JS
Jonathan Stratton
SciY

Sam Henson, PhD
synTQ Business Development Manager, Americas
SciY
Mars, Pennsylvania, United States- JS
Jonique Samuels, BS
Innovations Manager
SciY
Yate, England, United Kingdom - PG
Paul Gillham, BS
Director Innovations, SciY
SciY
Yate, England, United Kingdom - CA
Carl A. Anderson, Ph.D.
Associate Dean
Duquesne University
Pittsburgh, Pennsylvania, United States 
Md. Nahid Hasan, MS
Student
Duquesne University
Pittsburgh, Pennsylvania, United States
Presenter (non-author)(s)
Main Author(s)
Co-Author(s)
Methods: A four-component formulation was comprised of theophylline anhydrous (Parchem, USA), microcrystalline cellulose (MCC, Avicel PH101, IMCD, USA), lactose monohydrate (Merck, USA), and hydroxypropyl cellulose (HPC, Nisso America Inc., USA). Pre-weighed batches of 500 g were added to a mini-batch blender (Dome-Ex, Dalton Corporation, Japan). The system contained two blender blades, mixing and chopping, operated at 40 rpm and 1440 rpm, respectively. NIR spectra were collected with a diode array spectrometer (MicroNIR PAT-U, VIAVI Solutions Inc., Scottsdale, AZ, USA). Three sets of pure component spectra were collected: in-line – mini-batch blender (1000 g total), off-line - custom sample holder (134 g total), and minimal - small-scale custom sample holder (4 g total). Several additional spectra were collected for minute amounts of API to further demonstrate potential reductions in calibration burden (750 mg, 500 mg, 250 mg, 150 mg, 100 mg, 50 mg, 10 mg). Mixture spectra were collected during blending for the duration of the 1-minute blend time, resulting in 40 spectra per blend. Spectra were collected from 908-1678 nm with an 8.4 ms integration time and 50 co-adds. A total of 10 blends were prepared, and gravimetric values were used as the reference method for API potency. The IOT algorithm was accomplished with the system of equations shown in equation 1: min(eTe)
ε= Smix- Ssim= Smix-Kr Equation 1
Σr = 1; 0≤r≤1
Prediction performance was evaluated with root mean square error of prediction, calculated according to equation 2:
RMSEP = √((y-ȳ)2/n) Equation 2
Two diagnostics evaluated the prediction quality. First, the squared spectral residuals (SSR) diagnostic was calculated according to equation 3:
SSR = Σe2λ = Σ(Smix-Ssim)2 Equation 3
The second diagnostic, net analyte signal theta (NAS-T), represented as Θk,iNASwas calculated according to equation 4:
NASkideal=(I-K-k+ K-k) skpure
NASk, imix=(I-K-k+ K-k) simix
θk, iNAS=cos-1((∑NASk,imix*NASkideal) / (‖NASk,imix‖ ‖NASkideal‖)) Equation 4
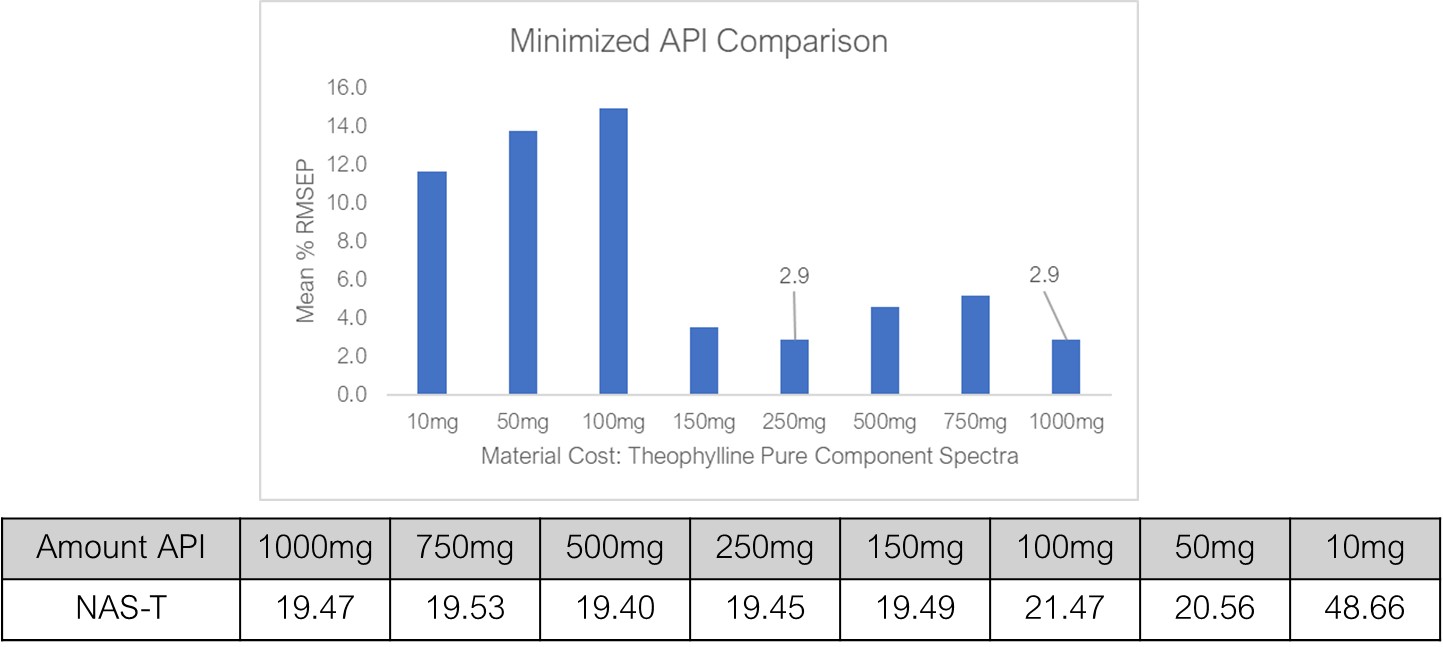
Results: The first comparison of prediction performance was between the in-line pure components and the off-line pure components. The off-line pure components had an RMSEP of 2.83 % compared to 11.55 % for the in-line pure components. The in-line and off-line pure components were combined to form spectral sets which were used to predict the mixture samples. The RMSEP showed a consistent trend, increasing as more in-line pure components were included. The NAS-T diagnostic showed no difference between the in-line and off-line pure components, but the SSR was clearly affected by the pure component collection conditions. When the results were labeled by MCC collection condition, it became clear that the MCC captured nonchemical variance which helped to match the overall spectral shape but distorted the prediction performance. Figure 1A shows the trend in RMSEP, and figure 1B shows the SSR trend with MCC collection conditions. Next, the prediction performance and diagnostics were compared for the off-line and minimal pure components. The RMSEP values were 2.70 and 2.17 for the off-line and minimal pure components, respectively, confirming the potential for drastic material cost reductions via IOT. This prompted the investigation to further reduce the amount of API required for model calibration, commonly cited as a limitation to PAT in early phase development. Spectra collected with minimal API showed accurate predictions with as little as 250 mg of API while maintaining a consistent NAS-T value, confirming reliable predictions. Figure 2 shows the minimized API results.
Conclusion: The API potency was predicted in a mini-batch blender with IOT using multiple sets of pure component spectra. The off-line spectra reduced the material consumption by 87%, and the minimal pure components provided a 99% reduction compared to in-line measurement. The prediction accuracy was comparable for off-line, minimal, and spectra using 250 mg API while maintaining an appropriate NAS-T value, providing confidence in predictions. This study demonstrates the ability of IOT, in conjunction with pure component collection conditions, to drastically reduce the material expenditure in chemometric modeling and potentiates the expansion of this PAT strategy to earlier phases of development.
References: 1. Rish, A. J., Henson, S., Drennen, J. K., & Anderson, C. A. (2024). Defining the range of calibration burden: from full calibration to calibration-free. Journal of Pharmaceutical Innovation, 19(3), 39.
Acknowledgements: The authors would like to acknowledge LCI for their support of this work..jpg) A-RMSEP trend across spectral sets, showing a gradual increase in prediction error as in-line pure components were added to the IOT input. B-SSR trend labeled by MCC collection condition, showing the effect of the nonchemical variance captured in the in-line environment.
A-RMSEP trend across spectral sets, showing a gradual increase in prediction error as in-line pure components were added to the IOT input. B-SSR trend labeled by MCC collection condition, showing the effect of the nonchemical variance captured in the in-line environment. Chart shows the RMSEP when the API spectrum collected with the designated amount of material was used, showing the comparability between the 1000 mg and 250 mg predictions. The chart shows the NAS-T values and confirms the reliability of the predictions.
