
Bioanalytics - Chemical
Nichlas Nässtrom, MS
PhD Student
Uppsala University
Uppsala, Uppsala Lan, Sweden
Nichlas Nässtrom, MS
PhD Student
Uppsala University
Uppsala, Uppsala Lan, Sweden
Mikael K. R. Engskog, Ph.D.
Lecturer
Uppsala University
Uppsala, Uppsala Lan, Sweden
David Balgoma, Ph.D.
Researcher
Uppsala University
Uppsala, Uppsala Lan, Sweden
Hans Lennernäs, Ph.D.
Professor
Uppsala University
Uppsala, Uppsala Lan, Sweden
Femke Heindryckx, Ph.D.
Senior Lecturer/Associate Professor
Uppsala University
Uppsala, Uppsala Lan, Sweden
Mikael Hedeland, Ph.D.
Professor
Uppsala University
Uppsala, Uppsala Lan, Sweden
.jpg) Figure 1. Horizontal bar chart showing the number of upregulated and downregulated lipid features by class for each treatment group. Lipid classes are sorted by total number of altered features. Bars represent counts of features with fold change >1.1 (upregulated) or <0.9 (downregulated) following treatment with atorvastatin, doxorubicin, or their combination.
Figure 1. Horizontal bar chart showing the number of upregulated and downregulated lipid features by class for each treatment group. Lipid classes are sorted by total number of altered features. Bars represent counts of features with fold change >1.1 (upregulated) or <0.9 (downregulated) following treatment with atorvastatin, doxorubicin, or their combination.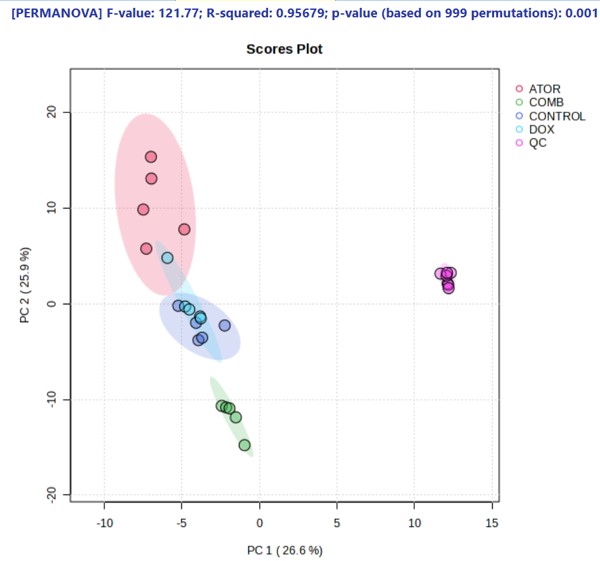 Figure 2. Principal Component Analysis (PCA) scores plot of lipidomic profiles (negative ion mode) from Huh-7 cells treated with atorvastatin (ATOR), doxorubicin (DOX), or their combination (COMB), alongside untreated controls and pooled quality control (QC) samples.
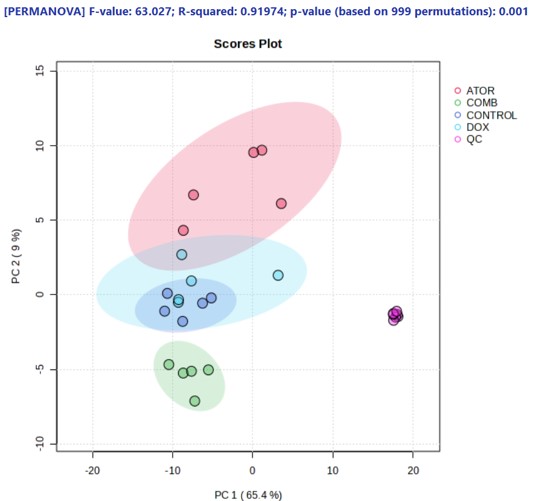 Figure 3. Principal Component Analysis (PCA) scores plot of lipidomic profiles (positive ion mode) from Huh-7 cells treated with atorvastatin (ATOR), doxorubicin (DOX), or their combination (COMB), alongside untreated controls and pooled quality control (QC) samples.