
Preclinical, Clinical, and Translational Sciences
 photo")
Kari Martyniak, PhD (she/her/hers)
Postdoctoral Fellow
Pfizer, Inc.
Andover, Massachusetts, United States
Kari Martyniak, PhD (she/her/hers)
Postdoctoral Fellow
Pfizer, Inc.
Andover, Massachusetts, United States
James C. Hickey, Ph.D.
Postdoctoral Fellow
Pfizer, Inc.
Andover, Massachusetts, United States
Patrick Lim Soo, Ph.D.
Group Leader- A. Res. Fellow- Drug Product Design & Dev (PhRD)
Pfizer, Inc.
Andover, Massachusetts, United States

Hendrik Neubert, Ph.D.
Head of BioTx and Large Molecule Biomarker Bioanalysis
Pfizer, Inc.
Andover, Massachusetts, United States

Jatin Narula, Ph.D.
A.R.Fellow MolecModel&Sim (R)
Pfizer, Inc.
Andover, Massachusetts, United States
Polina Goihberg, Ph.D.
Senior Principal Scientist, Cellular Biomeasures Lead
Pfizer, Inc.
Andover, Massachusetts, United States
.jpg) Fig. 1: Species-specific difference in transgene expression in MC3-Luciferase LNP-transfected human, cyno and rat hepatocytes. Cells were treated with different doses of MC3-Luciferase mRNA LNPs for the indicated time periods, as specified in the figure. Data shown as mean and SD of technical duplicates. *, below lower limit of detection and #, below lower limit of quantification for this assay. Each row represents a different donor (lot of cells).
Fig. 1: Species-specific difference in transgene expression in MC3-Luciferase LNP-transfected human, cyno and rat hepatocytes. Cells were treated with different doses of MC3-Luciferase mRNA LNPs for the indicated time periods, as specified in the figure. Data shown as mean and SD of technical duplicates. *, below lower limit of detection and #, below lower limit of quantification for this assay. Each row represents a different donor (lot of cells). 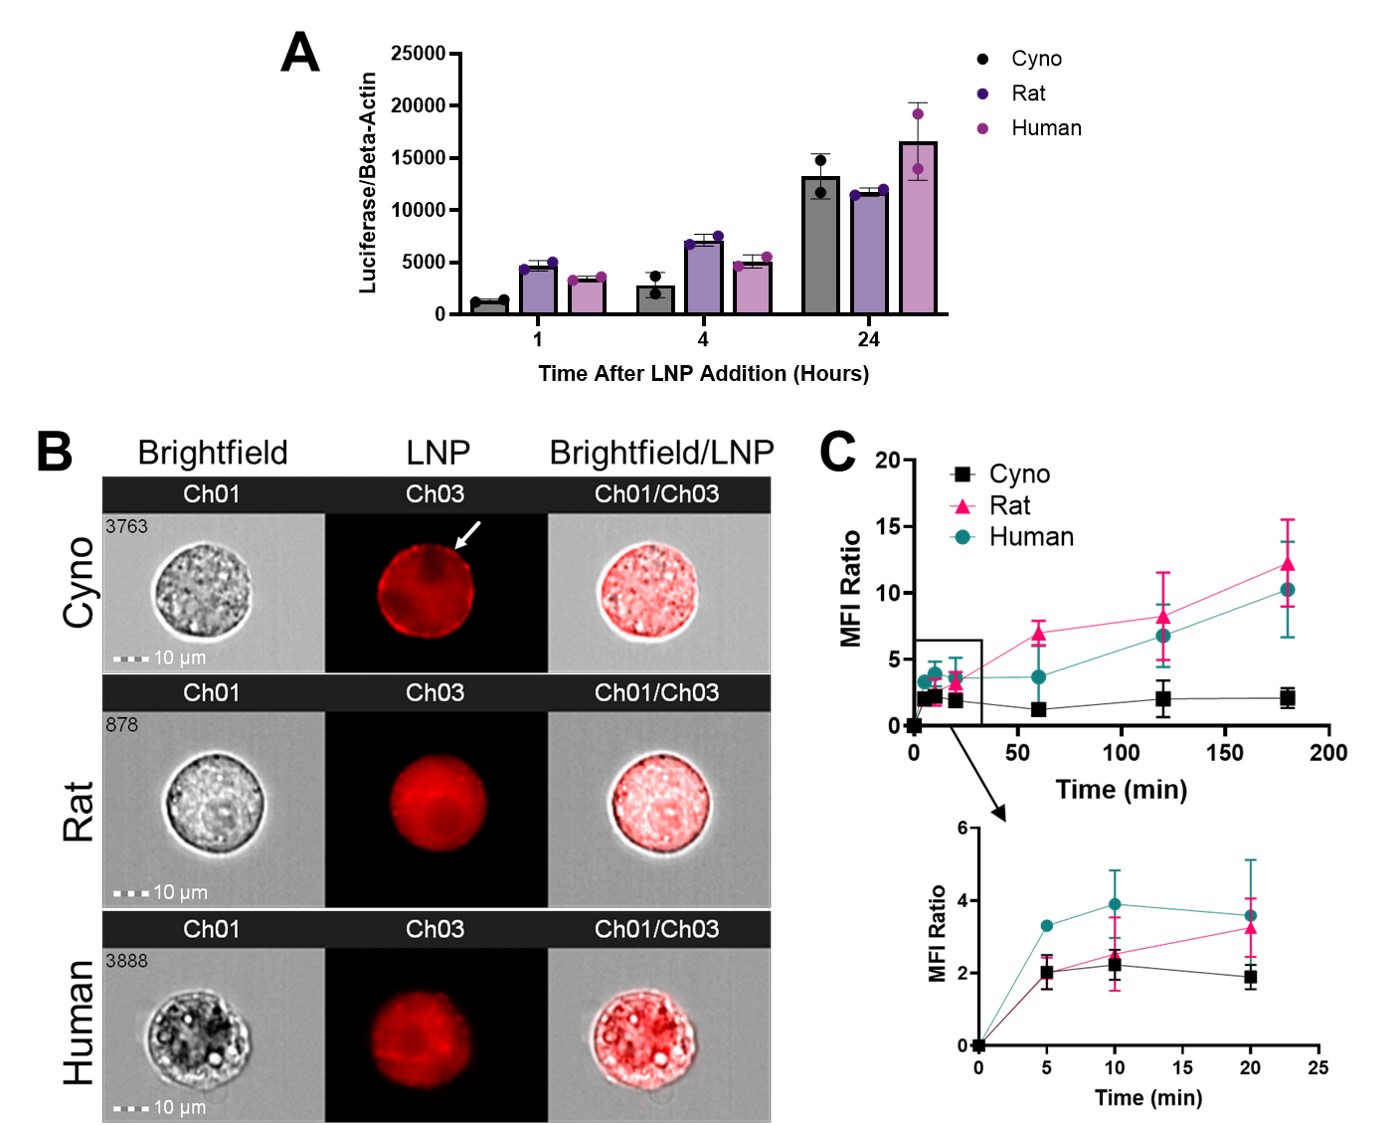 Fig. 2: Differences in LNP intracellular uptake in species hepatocytes. Primary hepatocytes from human, rat and cyno livers were treated with 2 pg/cell of unlabeled (A), or fluorescently-labeled MC3-Luciferase mRNA-LNPs, to differentiate between intracellular and membrane associated LNPs (B,C). (A) Luciferase mRNA was measured by dPCR at indicated time points after LNP addition, normalized to beta-actin house-keeping gene. (B) Representative images of hepatocytes incubated with LNPs (red) for 120 min at 37°C, generated by imaging flow cytometry. Note predominantly surface signal in cyno cells (arrow). (C) Time-dependent LNP association with cells was measured by flow cytometry by analyzing difference in fluorescence signal in samples incubated with LNPs on ice and at 37°C (allows active internalization). Graphs summarize time-dependent changes in the extent of LNP uptake, expressed as the ratio of the fluorescence signal (MFI) between the conditions. Data shown as mean and SD of biological replicates, n=2.
 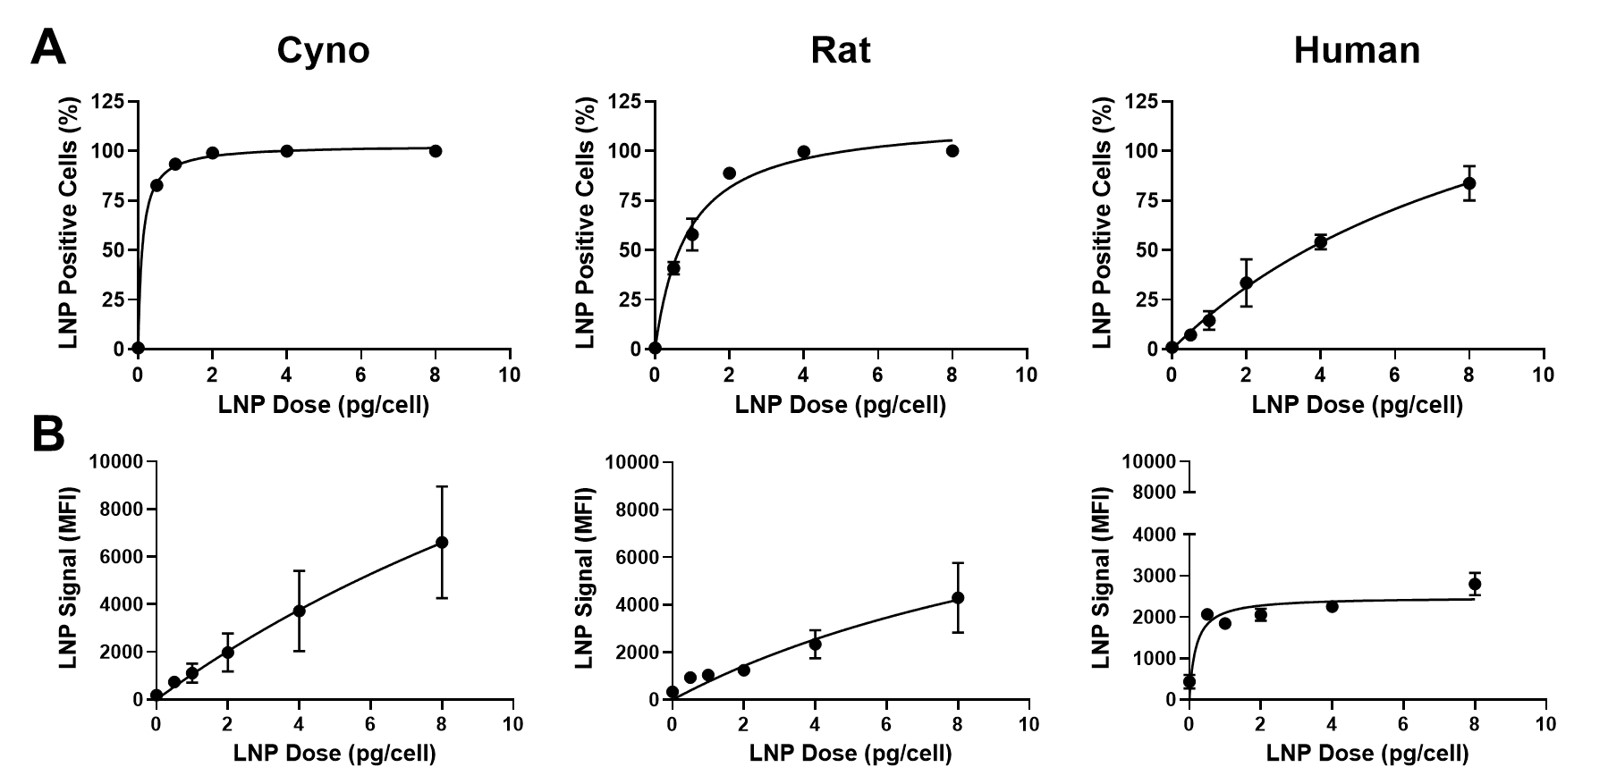 Fig. 3: Comparison of dose-dependent LNP binding in hepatocytes from different species. Cells were incubated with increasing doses of fluorescently-tagged MC3-Luciferase LNPs, as specified in the figure, for 60 min on wet ice to allow membrane association and minimize internalization. Frequency of LNP positive cells (A) and relative LNP signal per cell (B) of the labeled LNP was analyzed by flow cytometry.