
Manufacturing and Analytical Characterization - Chemical
Rahul Haware, Ph.D.
Director
Natoli Scientific
Telford, Pennsylvania, United States
Rahul Haware, Ph.D.
Director
Natoli Scientific
Telford, Pennsylvania, United States
Kerry Cruz
Lab Manager
Natoli Scinetific
Telford, Pennsylvania, United States
Robert Sedlock, MS
Director
Natoli Scinetific
Telford, Pennsylvania, United States
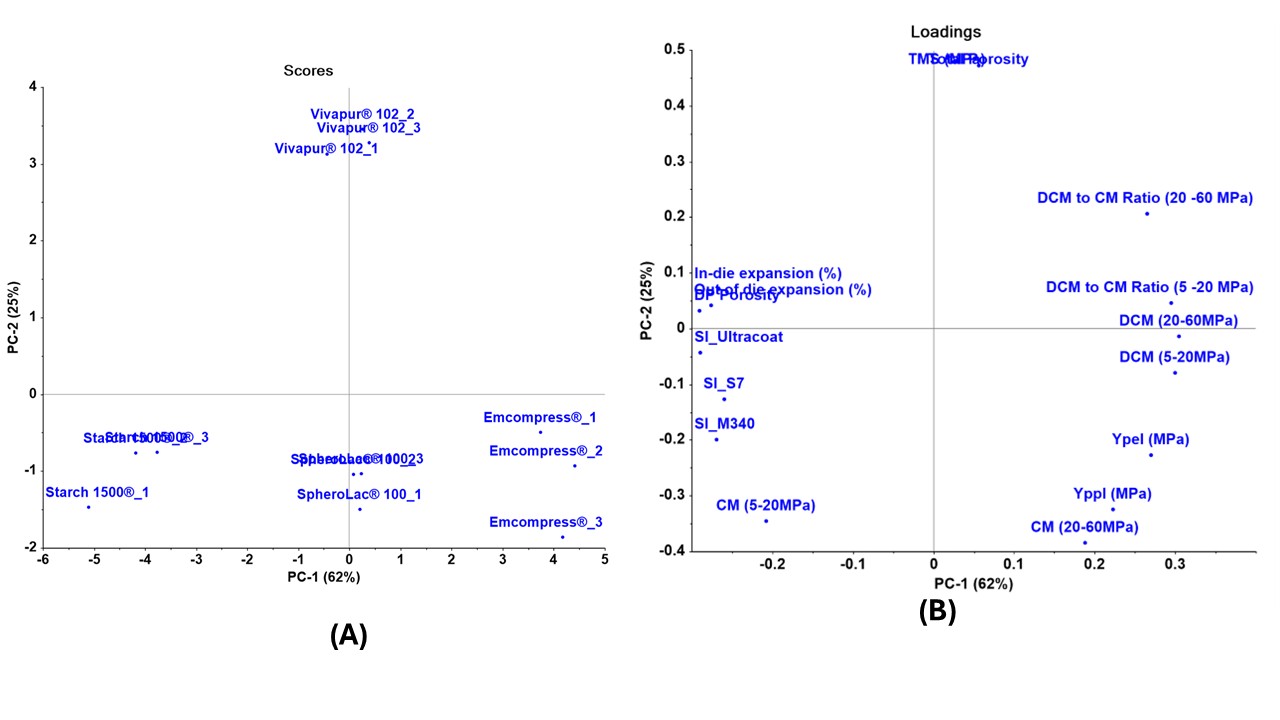 Figure 1 (A) The principal component (PCA) score plot: (B) Loading plot of material strength, material deformation properties, and sticking index. The first two principal components display explain 87% data variance.
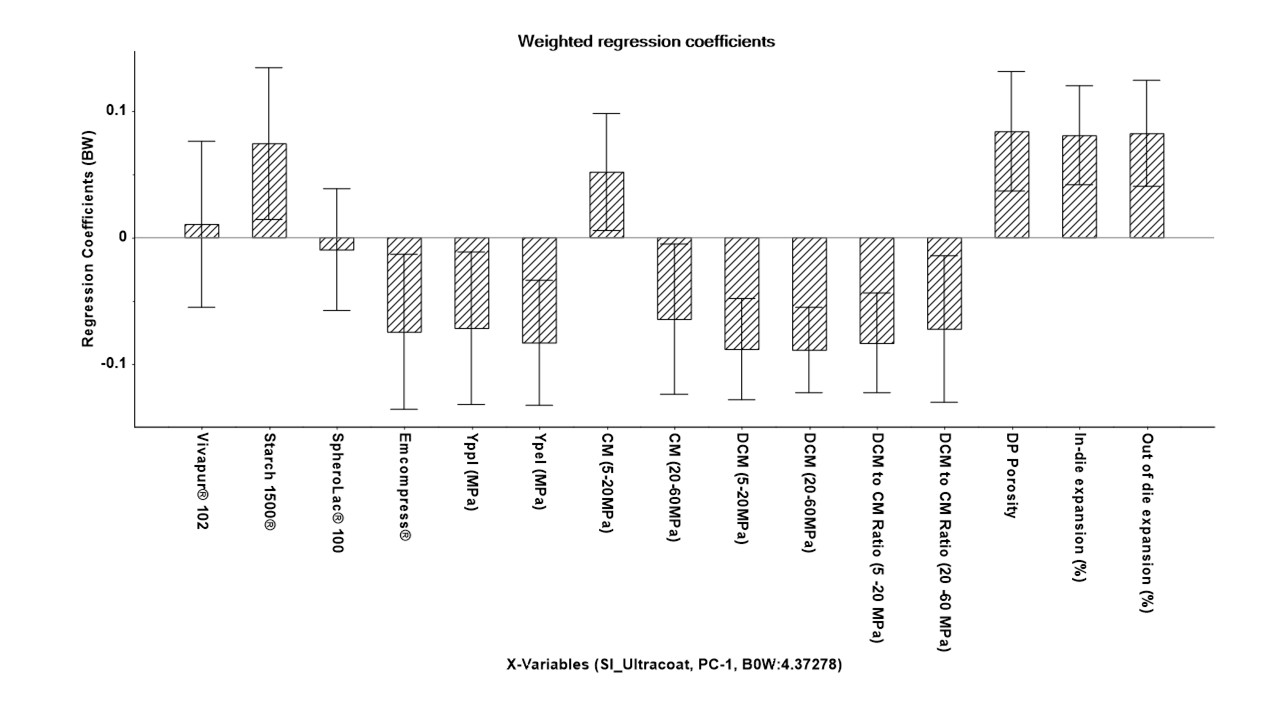 Figure 2 A representative Principal component regression (PCR-1) model for Sticking Index with M340 metal coupons. The significance of regression is determined by full cross-validation and Marten’s uncertainty test and corresponds to approximately p<0.005. Bars are 95% confidence bars. A positive (+) and negative (-) sign indicates a positive and negative impact on material’s M340 SI index.