
Formulation and Delivery - Chemical
 photo")
Zekun Li, MS (he/him/his)
PhD Student
Northeastern University
Boston, Massachusetts, United States
Zekun Li, MS (he/him/his)
PhD Student
Northeastern University
Boston, Massachusetts, United States

Weizhou Yue, Ph.D.
Postdoc
Northeastern University
Boston, Massachusetts, United States
Megan Johnsen, BS
Undergraduate student
Northeastern University
Boston, Massachusetts, United States
Daniel M. Shen
Student
Northeastern University
Boston, Massachusetts, United States
Saleh Allababidi, Ph.D.
Associate Teaching Professor
University of Rhode Island
Kingston, Rhode Island, United States
Wei-Jhe Sun, Ph.D.
Senior Pharmacologist
US Food and Drug Administration
Silver Spring, Maryland, United States
 photo")
Sami Nazzal, PhD (he/him/his)
Senior Pharmacologist
US Food and Drug Administration
Silver Spring, Maryland, United States
 photo")
Manar AI-Ghabeish, Ph.D. (she/her/hers)
Senior Pharmacologist
US Food and Drug Administration
Silver Spring, Maryland, United States

Heather J. Boyce, Ph.D.
LEAD PHARMACOKINETICIST
US Food and Drug Administration
Silver Spring, Maryland, United States
.jpg "Fang Wu, Ph.D. photo")
Fang Wu, Ph.D.
Review Senior Pharmacologist
US Food and Drug Administration
Silver Spring, Maryland, United States
Zhen Zhang, Ph.D. (he/him/his)
Master Pharmacologist
US Food and Drug Administration
Silver Spring, Maryland, United States
Renishkumar R. Delvadia, Ph.D.
Senior CMC Drug Product Reviewer
US Food and Drug Administration
Silver Spring, Maryland, United States
 photo")
Jie Shen, Ph.D. (she/her/hers)
Professor
Northeastern University
Boston, Massachusetts, United States
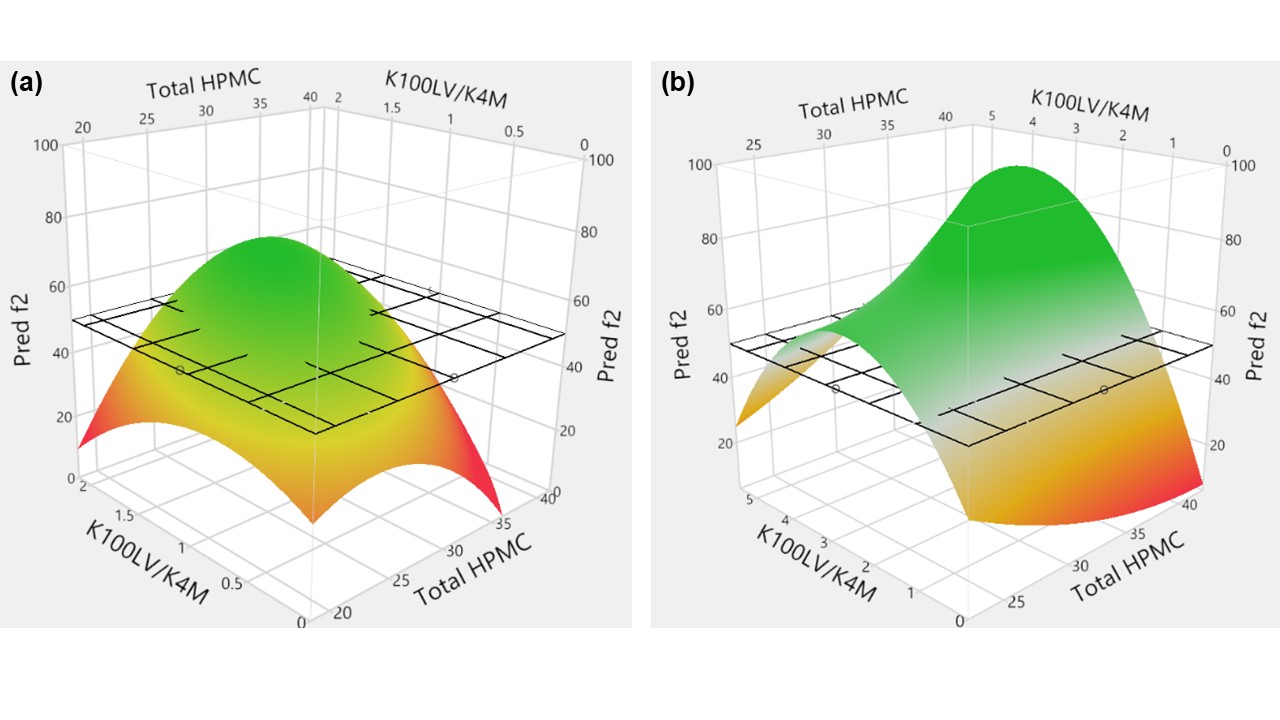 Figure 1. Response surface plots generated using JMP® to visualize the design space for (a) EQ 200 mg Base and (b) EQ 300 mg Base strength quetiapine fumarate extended-release tablet formulations. Formulation compositions with predicted similarity factor f2 (Y axis) ≥ 50 (Green zone above the grid surface) compared to the reference listed drug Seroquel XR® products were defined as the safe formulation design space. Two grades of HPMC K100LV and K4M were studied.
 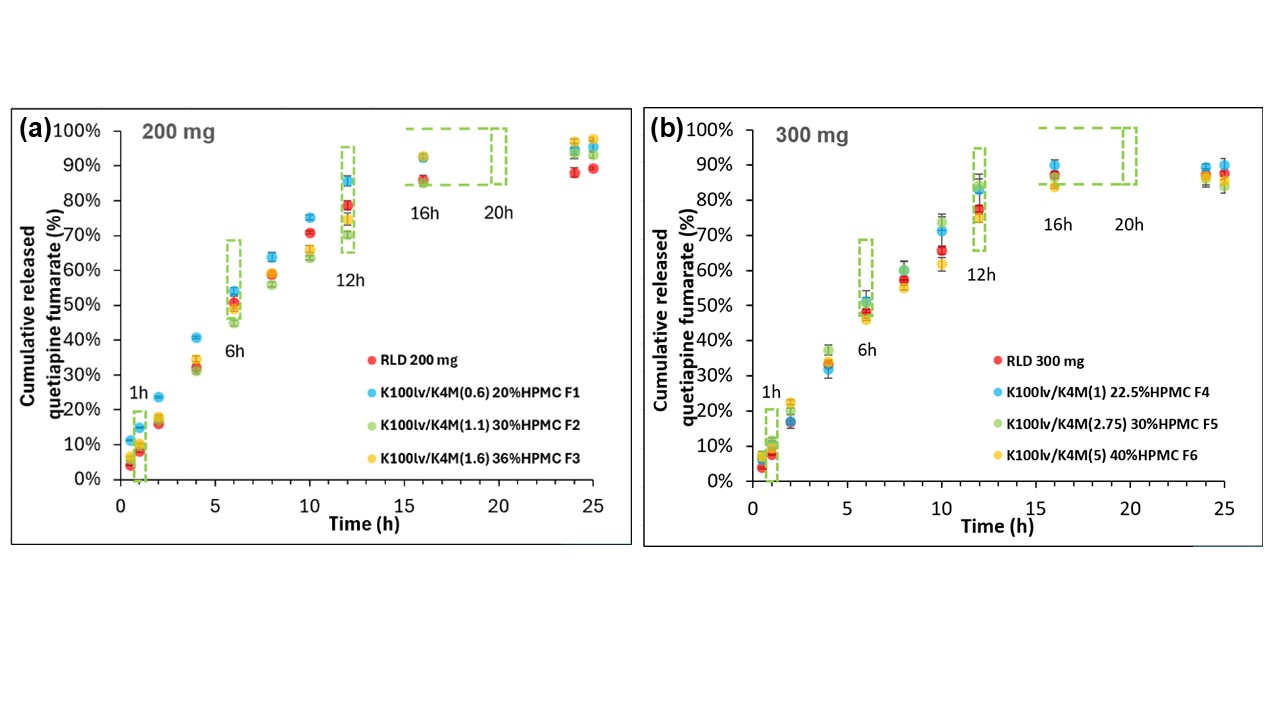 Figure 2. The in vitro dissolution profiles of LM QF ER tablet formulations across the 200 mg and 300 mg strengths obtained using USP apparatus 1 at 200 rpm (250 after 24 hr) with 20-mesh baskets in biphasic media (0.05 M citric acid and 0.09 N NaOH, pH 4.8 for first 5 hours followed by the addition of 100 mL of 0.05 M dibasic sodium phosphate dodecahydrate and 0.46 N NaOH to achieve a final pH of 6.6) (n=3, mean±SD). (a) EQ 200 mg Base strength: formulations F1 (K100LV/K4M ratio=0.6, 20% total HPMC), F2 (K100LV/K4M ratio=1.1, 30% total HPMC) and F3 (K100LV/K4M=1.6, 36% total HPMC) with f2 factors of 59.71, 64.97, and 53.70, compared to Seroquel XR® EQ 200 mg Base strength. (b) EQ 300 mg Base strength: formulations F4 (K100LV/K4M= 1, 22.5% total HPMC), F5 (K100LV/K4M= 2.75, 30% total HPMC) and F6 (K100LV/K4M=5, 40% total HPMC) with f2 factors of 71.79, 67.06, and 73.22, compared to Seroquel XR® EQ 300 mg Base strength. USP dissolution specifications (Test 1) for QF release are indicated by dashed green boxes.