
Formulation and Delivery - Chemical

Nethra Viswaroopan, BS
Ph.D. Student
Mercer University
Atlanta, Georgia, United States
Nethra Viswaroopan, BS
Ph.D. Student
Mercer University
Atlanta, Georgia, United States

Meheli Ghosh, MS
Graduate Student
Mercer University
Atlanta, Georgia, United States
Jasim Khan, PhD
PhD
University of Alabama
Atlanta, Georgia, United States
Ritesh K. Srivastava, Ph.D.
Post doc
University of Alabama
Birmingham, Alabama, United States
Mohammad Athar, Ph.D.
Professor
University of Alabama
Atlanta, Georgia, United States

Ajay K. K. Banga, PhD
Professor
Mercer University
Atlanta, Georgia, United States
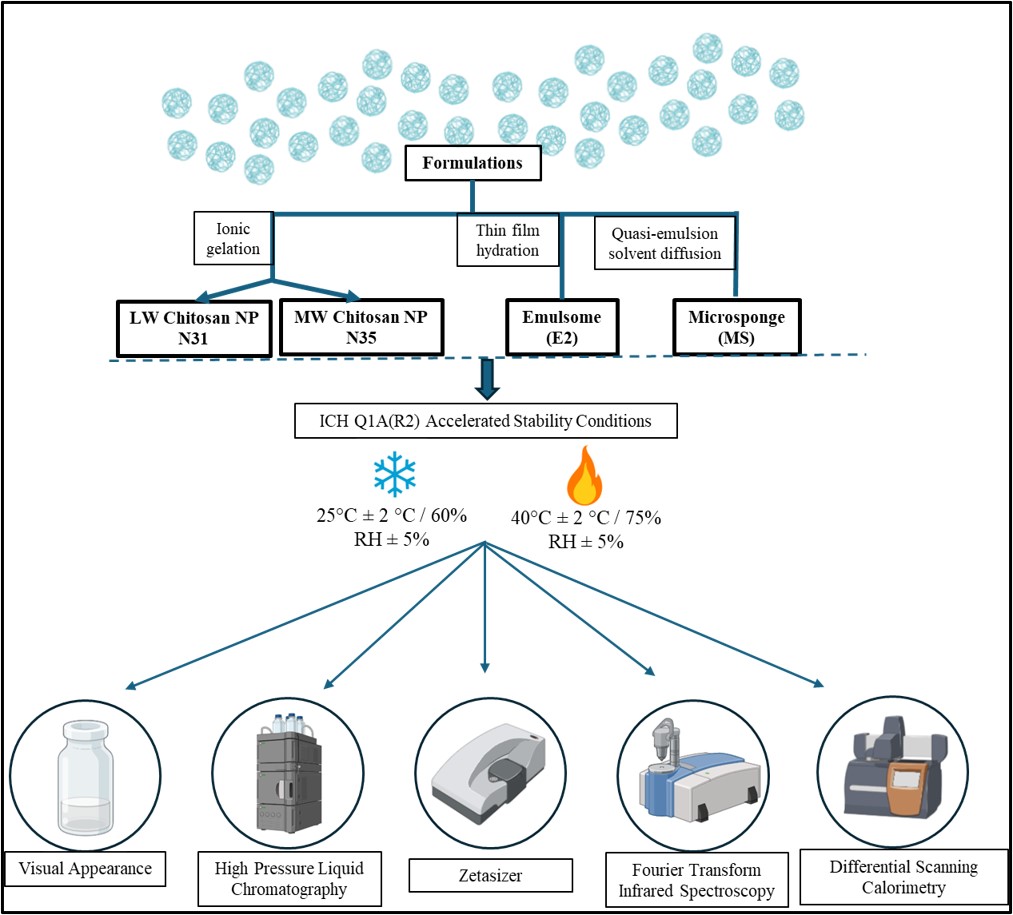 Fig 1. Schematic representation of the stability testing workflow for nanoparticle formulations
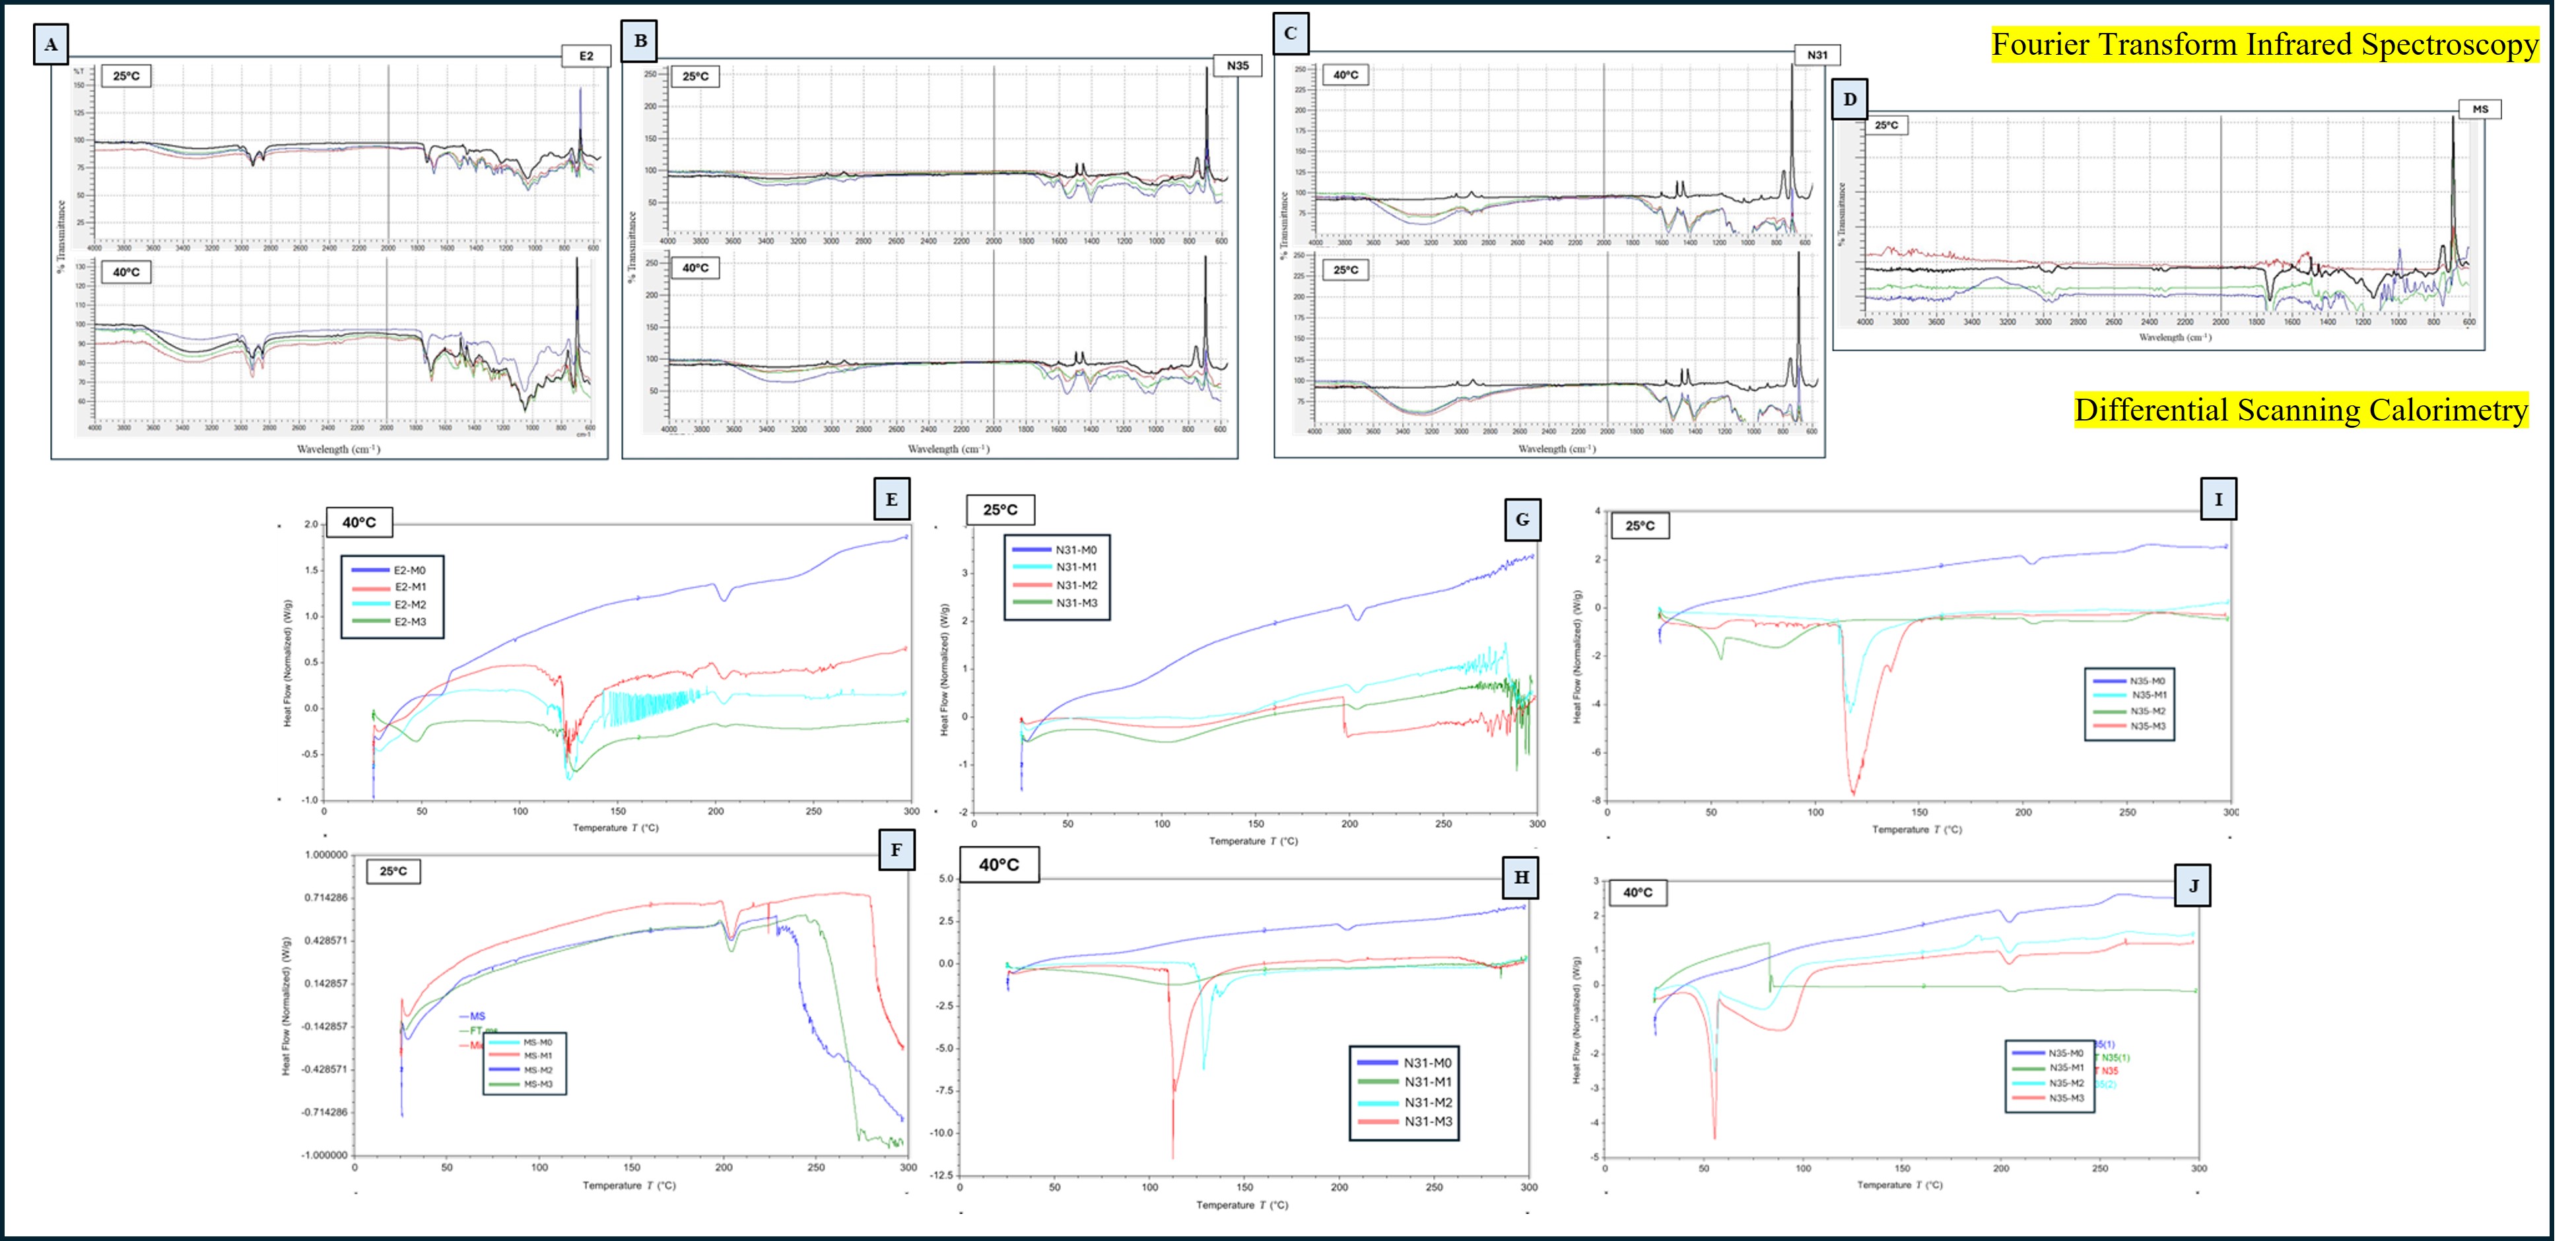 Fig 2. (A) FT-IR overlay of E2 nanoparticles stored at 25°C and 40°C over 3 months (B) FT-IR overlay of N35 nanoparticles stored at 25°C and 40°C (C) FT-IR overlay of N31 nanoparticles at 25°C and 40°C (D) FT-IR overlay of MS nanoparticles at 25°C . (E) DSC thermograms of E2 formulations at 40°C for 3 months (F) DSC thermograms of MS formulations at 25°C for 3 months (G) DSC thermograms of N31 nanoparticles at 25°C for 3 months (H) DSC thermograms of N31 nanoparticles at 40°C for 3 months (I) DSC thermograms of N35 nanoparticles at 25°C for 3 months (J) DSC thermograms of N35 nanoparticles at 40°C for 3 months.
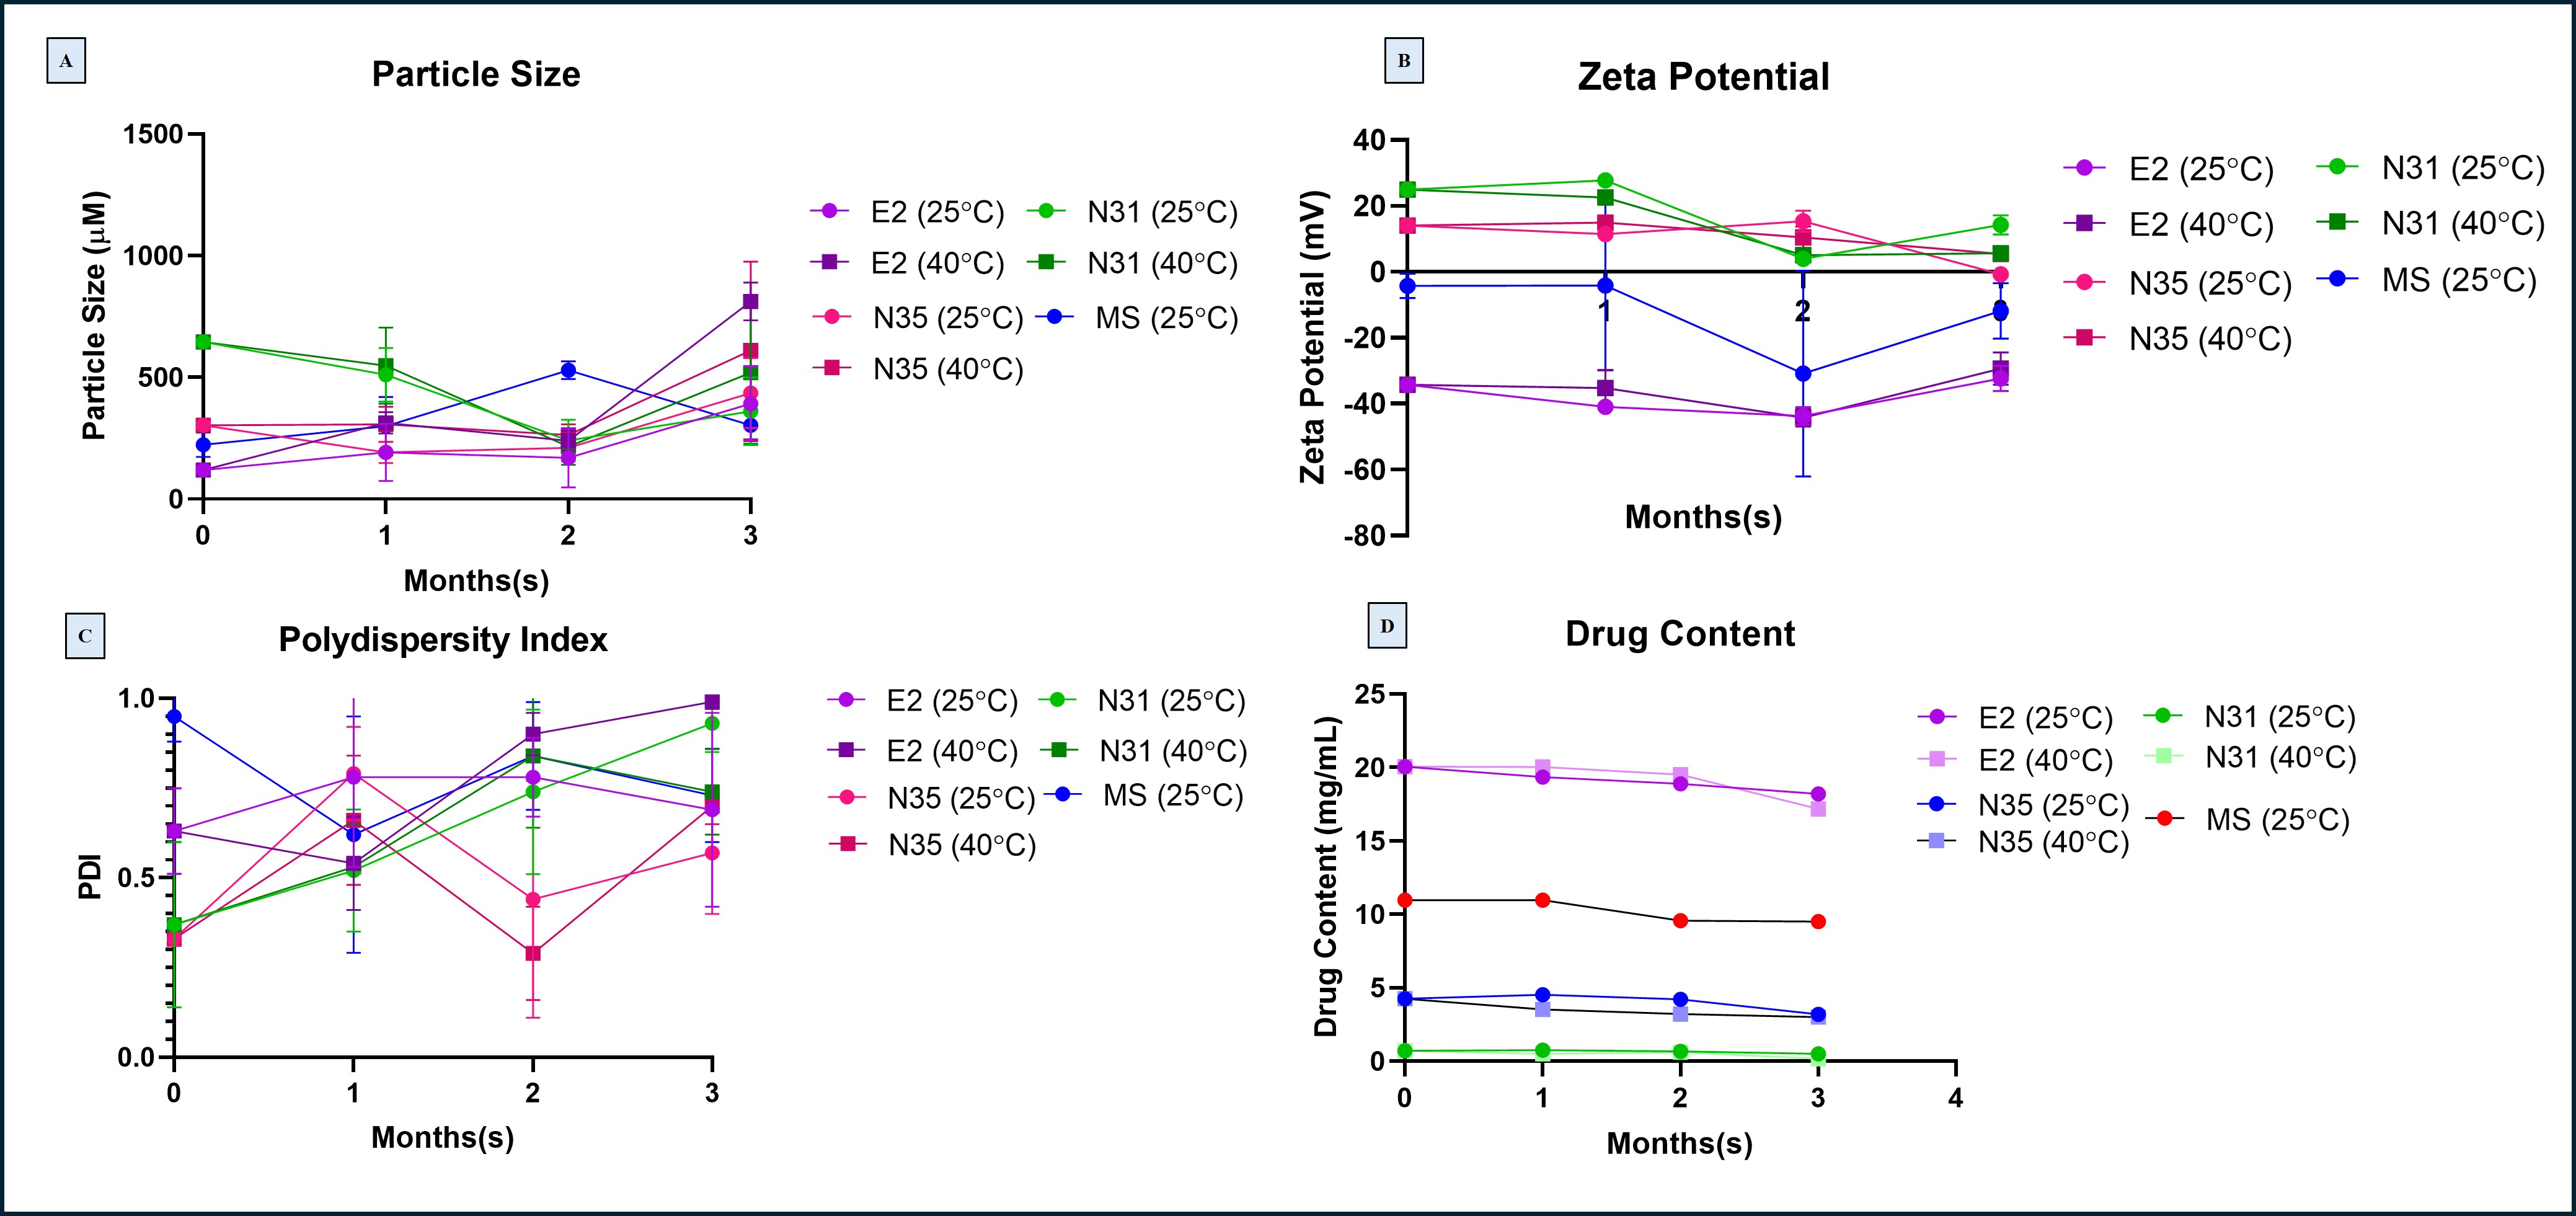 Fig 3. (A) Particle size of N31, N35, E2, and MS nanoparticles measured over 3 months at 25°C and 40°C storage conditions (B) Zeta potential values of nanoparticle formulations during stability study (C) Polydispersity index (PDI) of nanoparticles across 3 months, indicating changes in size distribution (D) Drug content of 4-PBA in nanoparticles measured monthly by HPLC