
Manufacturing and Analytical Characterization - Chemical
Rahul Haware, Ph.D.
Director
Natoli Scientific
Telford, Pennsylvania, United States
 photo")
Luca Orefice, PhD (he/him/his)
Senior Scientist
MercuryLab B.V.
Enschede, Overijssel, Netherlands
Grant Sedlock
Technical Representative
Natoli Scientific
Telford, Pennsylvania, United States
Robert Sedlock, MS
Director
Natoli Scinetific
Telford, Pennsylvania, United States
.jpg) Figure 1A PCA scores plot. The first 2 principal components displayed 59% variance in the data.
Figure 1A PCA scores plot. The first 2 principal components displayed 59% variance in the data..jpg) Figure 1B PCA loadings plot. The first 2 principal components displayed 59% variance in the data.
Figure 1B PCA loadings plot. The first 2 principal components displayed 59% variance in the data.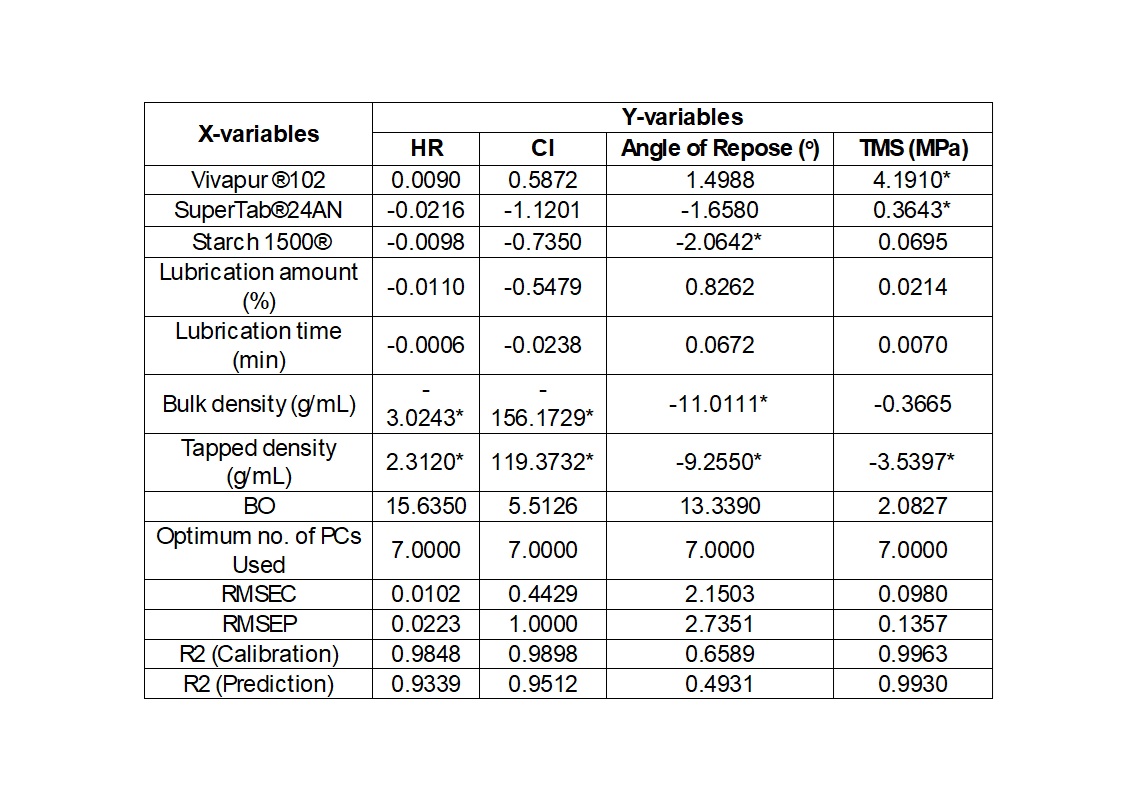 Table 1 Regression coefficients of design variables on HR, CI, angle of repose, and TMS obtained in a separate PLS-1 models. (The significance of regression is determined by full cross-validation and Marten’s uncertainty test and corresponds to approximately p<0.05; (-) indicates negative and (+) indicates positive significance. * Indicates statistically significant impact. RMSEC and RMSECP means root mean square error at calibration and prediction, respectively)