
Formulation and Delivery - Chemical
Sumedha Kapre, MS
Graduate Teaching Assistant
Texas A&M University
Kingsville, Texas, United States
Sumedha Kapre, MS
Graduate Teaching Assistant
Texas A&M University
Kingsville, Texas, United States
Sushesh Srivatsa Palakurthi, MS
Ph.D. Candidate
Texas A&M University
Kingsville, Texas, United States
Maharshi Thalla, Ph.D.
Postdoctoral Research Associate
Texas A&M University
Kingsville, Texas, United States
Narangerel Altangerel, Ph.D.
Postdoctoral Research Associate
Texas A&M University
College Station, Texas, United States
Sarea Phillips, MS
Graduate Student
Texas A&M University
College Station, Texas, United States
Srinath Palakurthi, Ph.D. (he/him/his)
Professor
Texas A&M University
Kingsville, Texas, United States
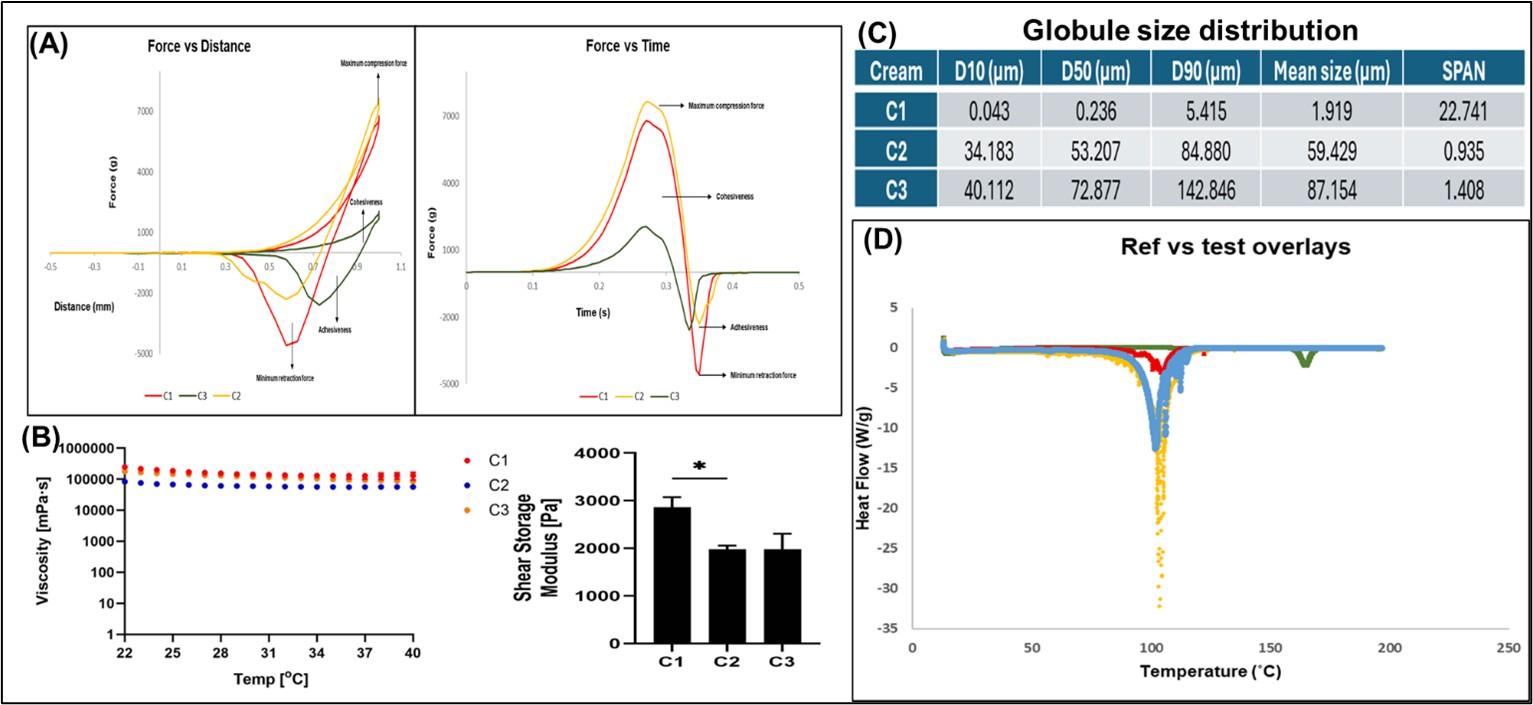 Figure 1: Physicochemical and structural characterization of pimecrolimus 1% creams. (A) Texture analysis of the creams was performed at room temperature (RT) using an XT Plus texture analyzer. Adhesive, cohesive, and mechanical forces were assessed and plotted as force vs. distance and force vs. time.
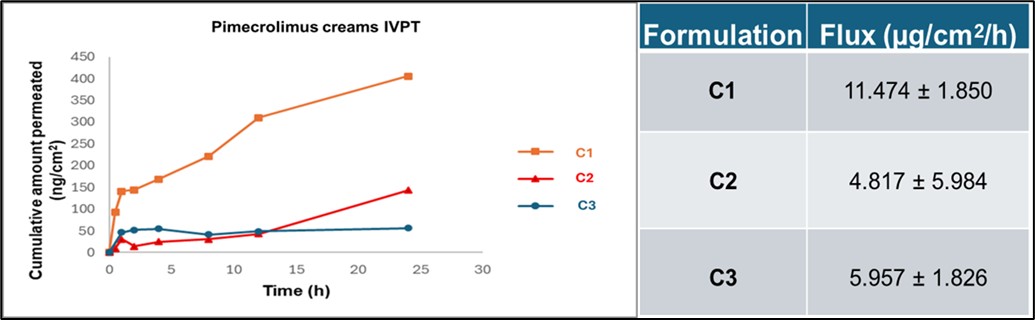 Figure 2: In vitro permeation studies were conducted using vertical Franz diffusion cells with a receptor volume of 5 mL and a donor surface area of 0.2 cm². The receptor medium consisted of 1× phosphate-buffered saline (PBS) containing 30% Transcutol® HP, pH 7.2. Porcine ear skin was prepared, cut to uniform thickness, and mounted between the donor and receptor compartments. The experiment was carried out for 24 hours at 32 ± 0.5 °C. Samples were collected at predetermined time intervals and analyzed for pimecrolimus content. All experiments were performed in triplicate (n = 3), and results are reported as cumulative amount permeated (ng/cm²) versus time. Steady-state flux values were calculated and expressed as mean flux ± standard deviation (S.D.).
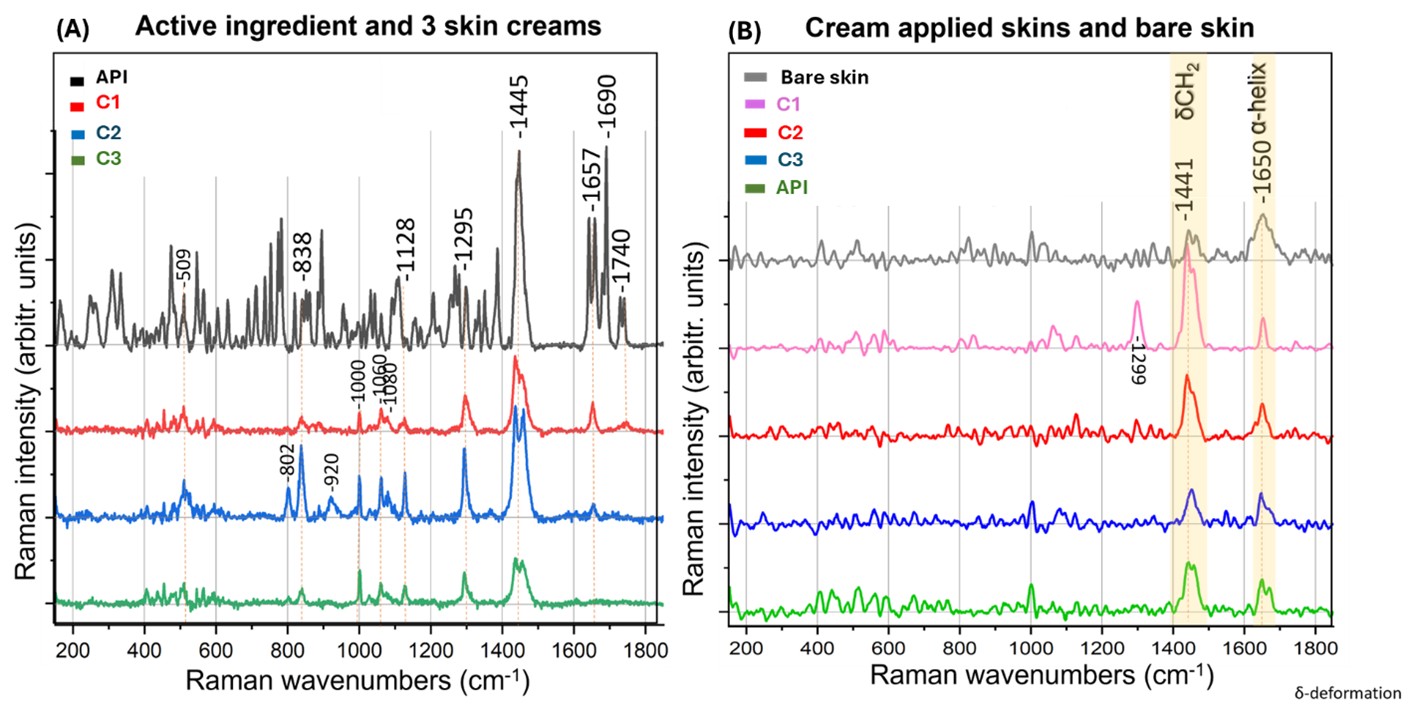 Figure 3: Representative Raman spectra were obtained using a confocal Raman microscope (LabRAM HR Evolution, HORIBA) within the fingerprint region (150–1850 cm⁻¹). Samples of pimecrolimus, as well as cream formulations C1, C2, and C3, were imaged both on microscope slides and on porcine ear skin membranes.